Figures for Time-Mean Fields
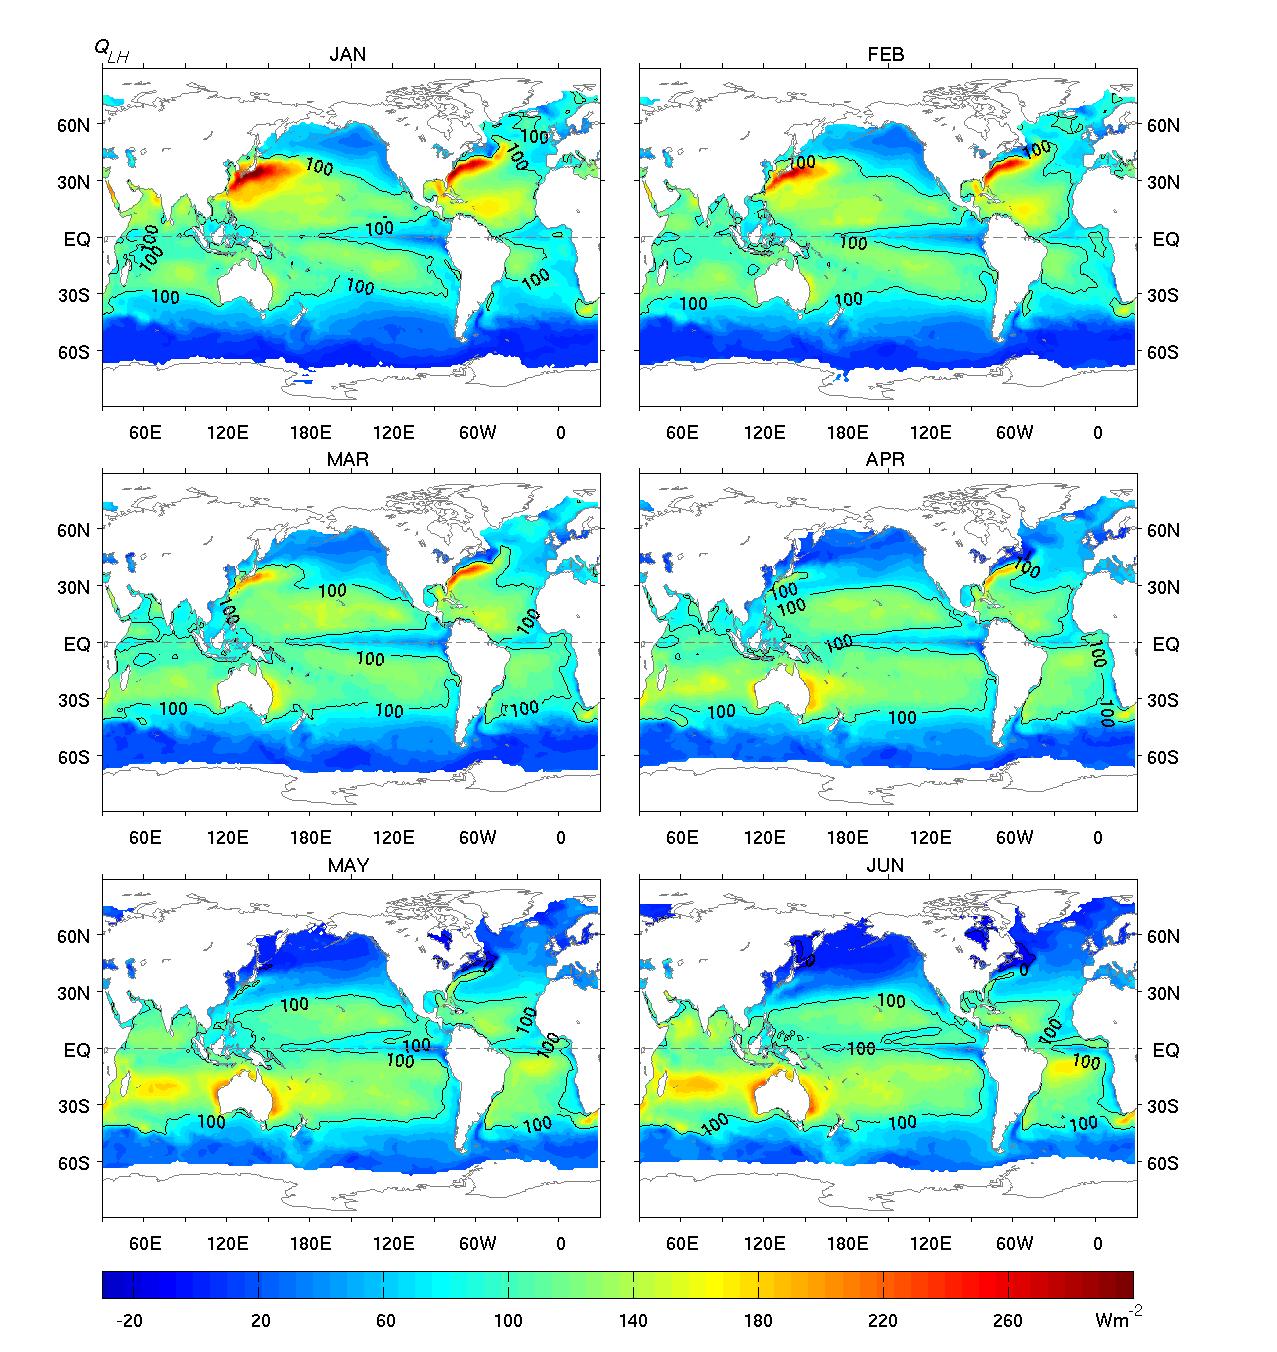
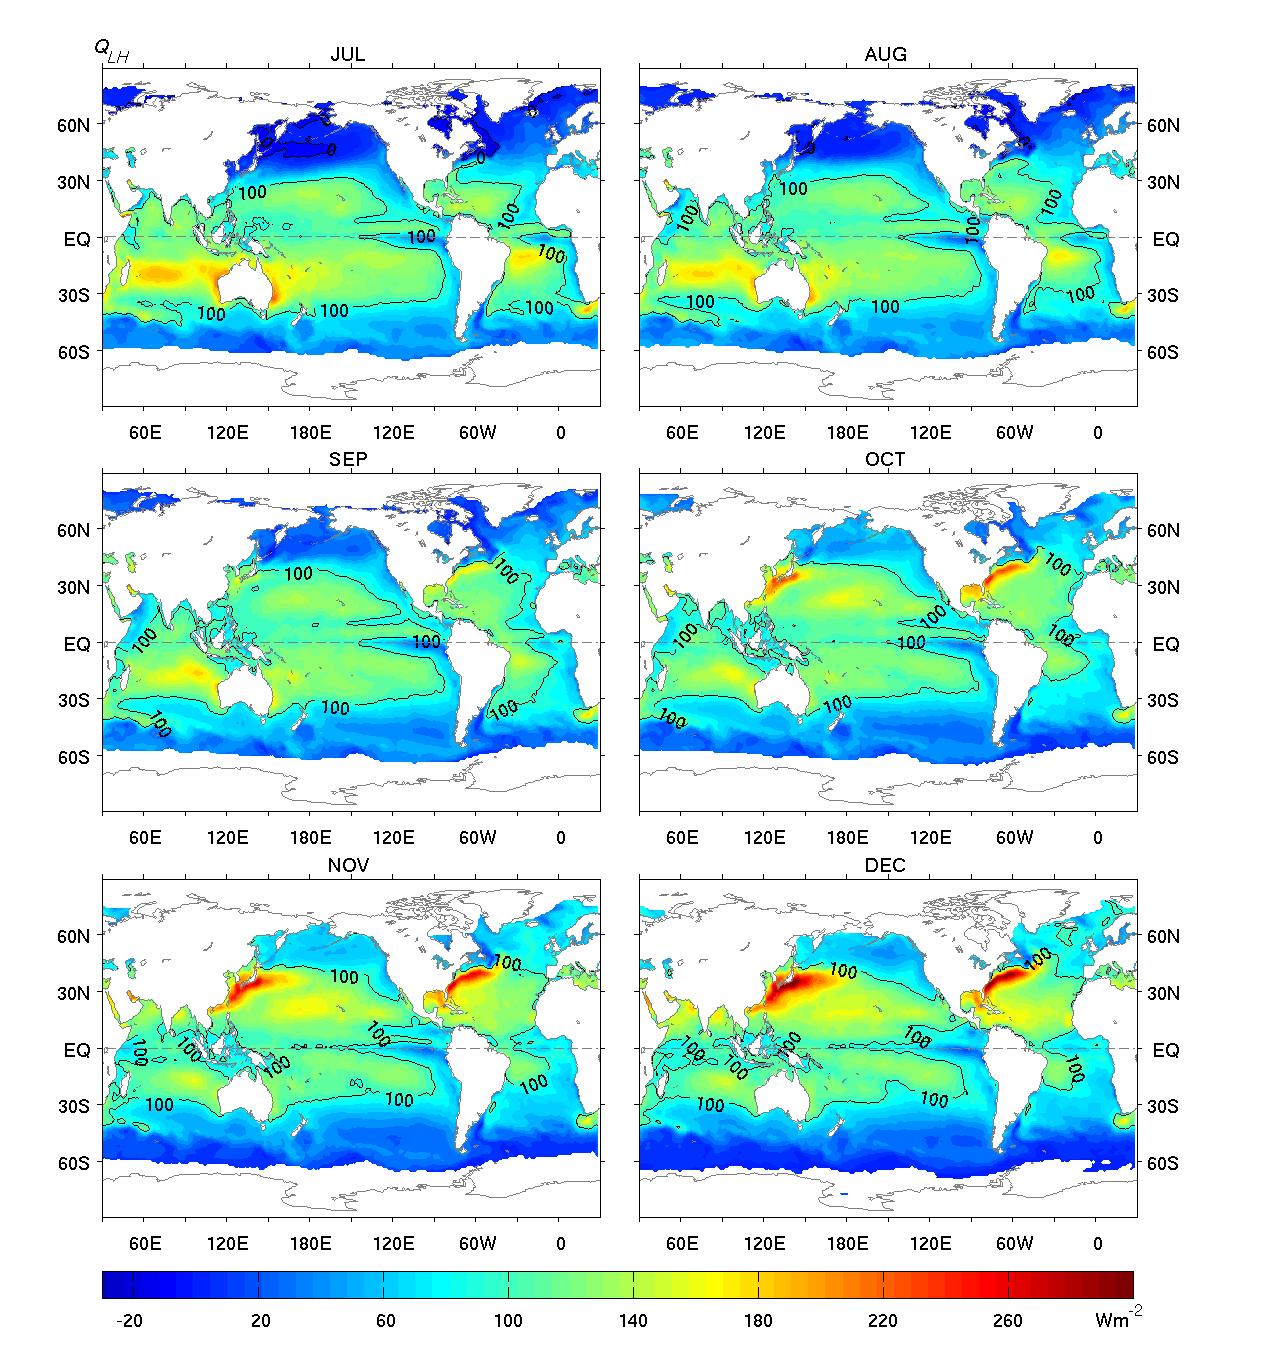
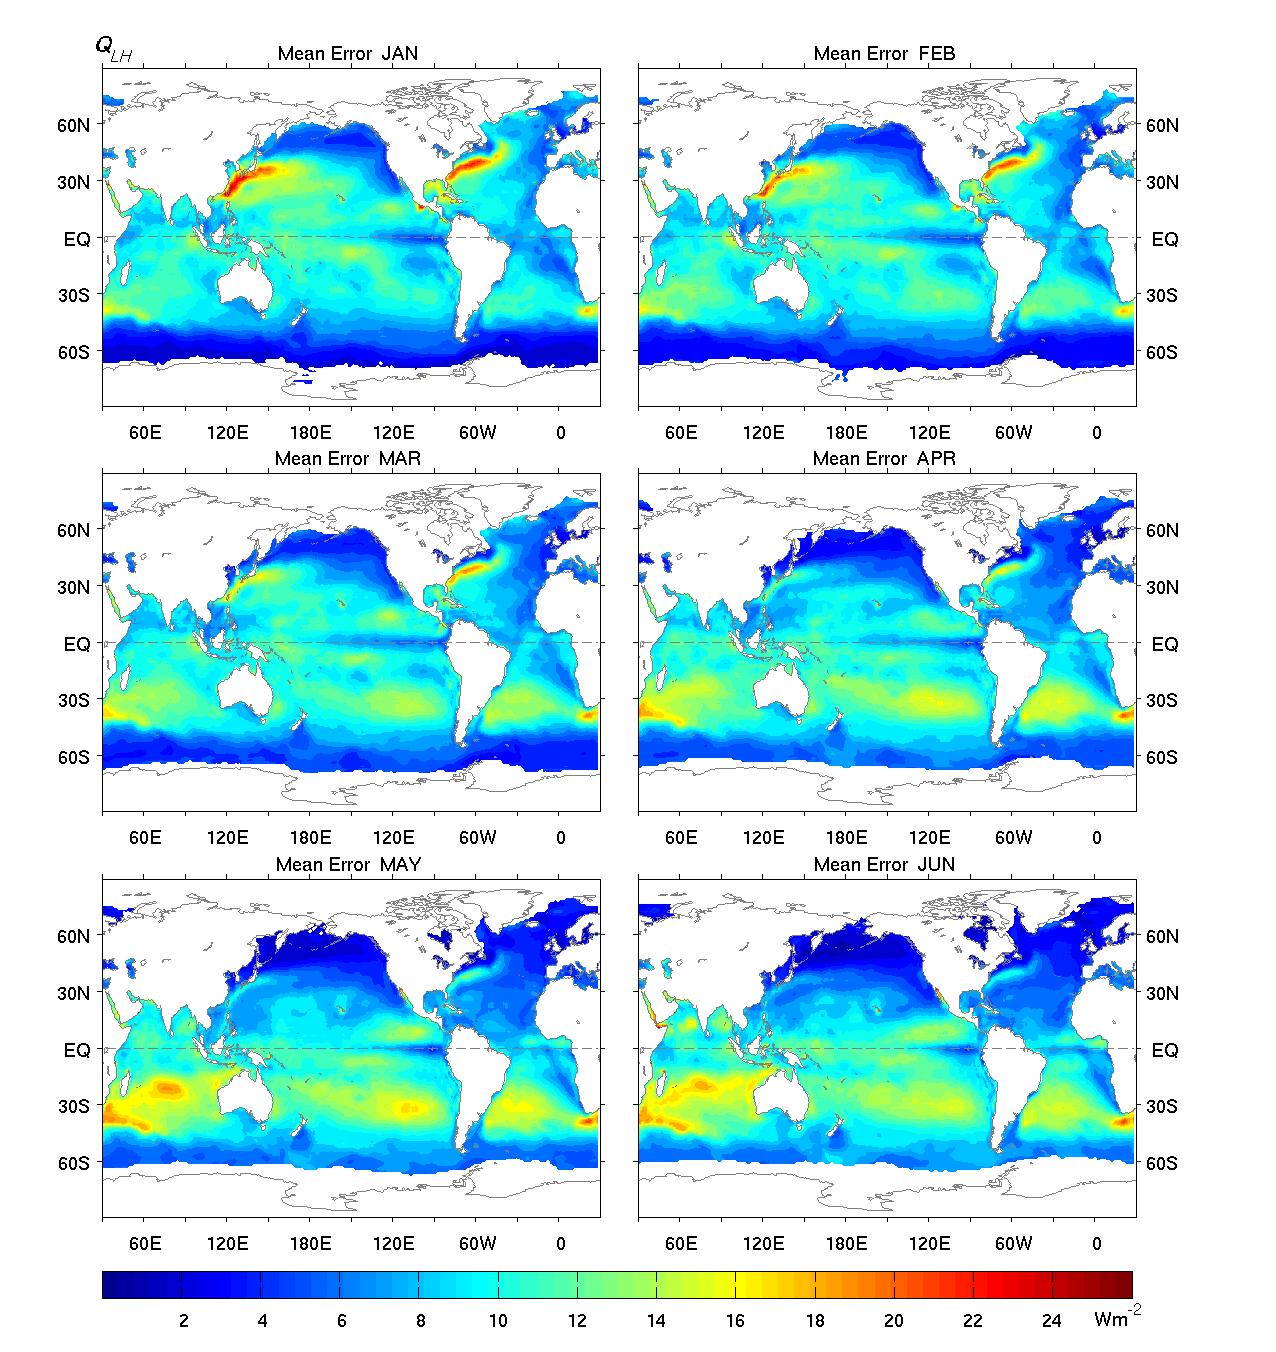
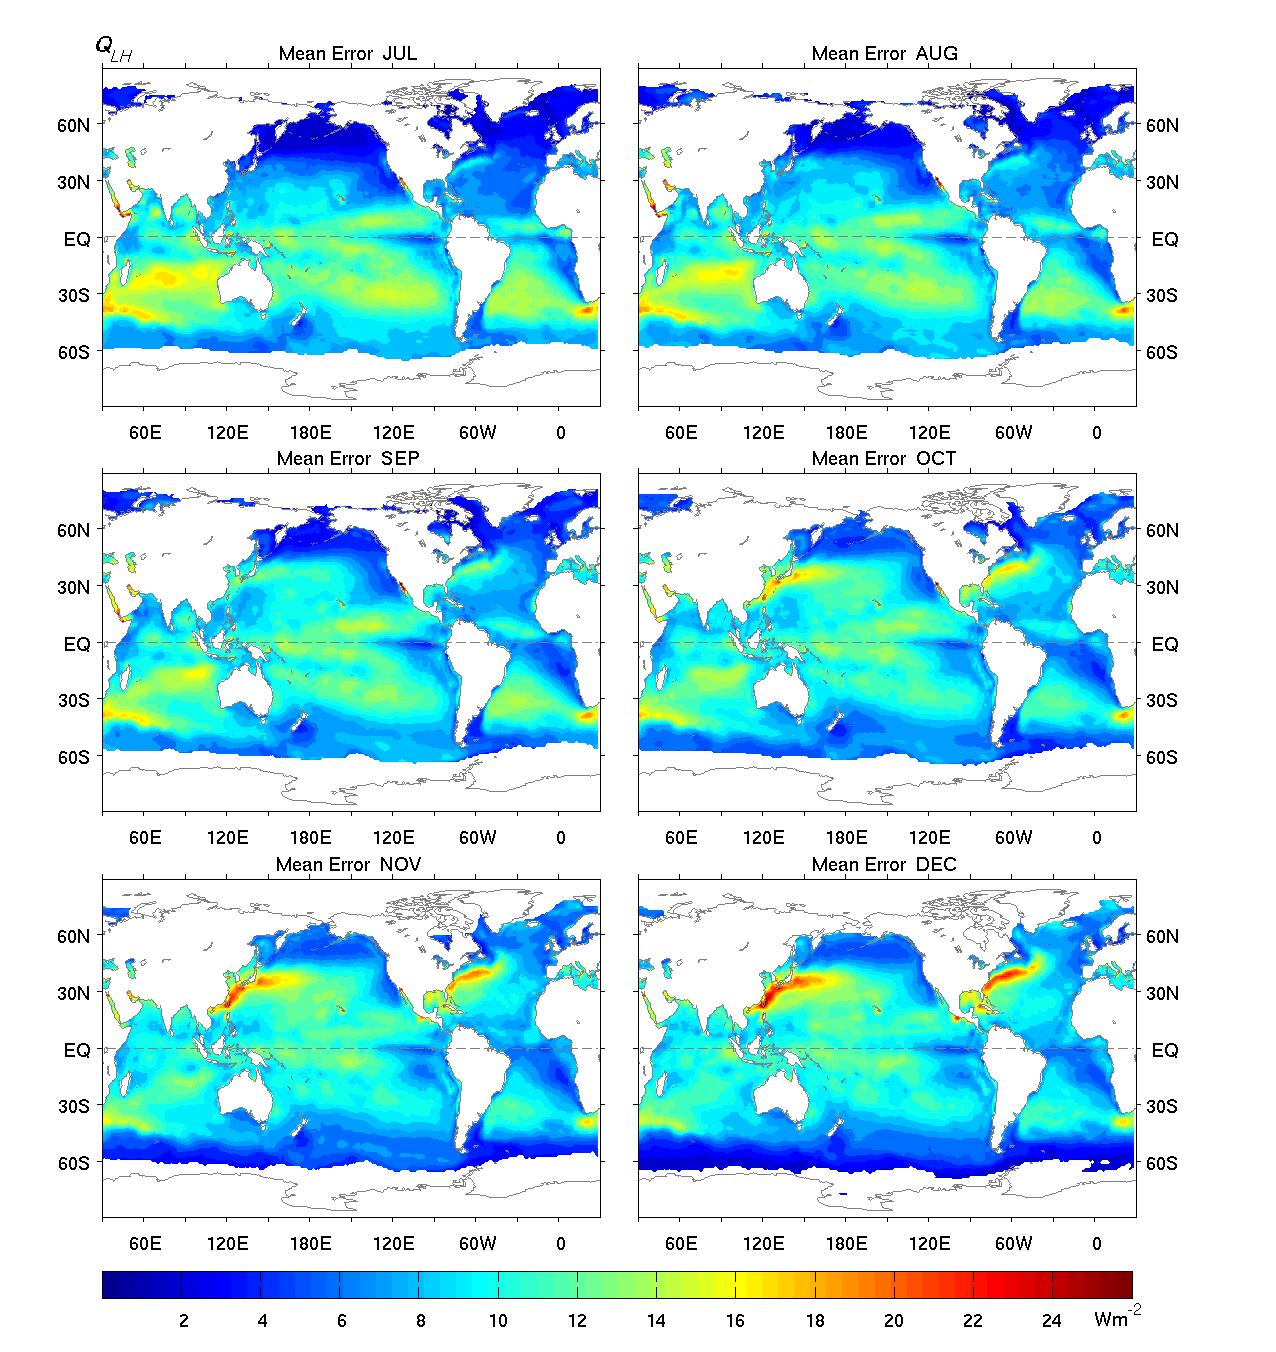
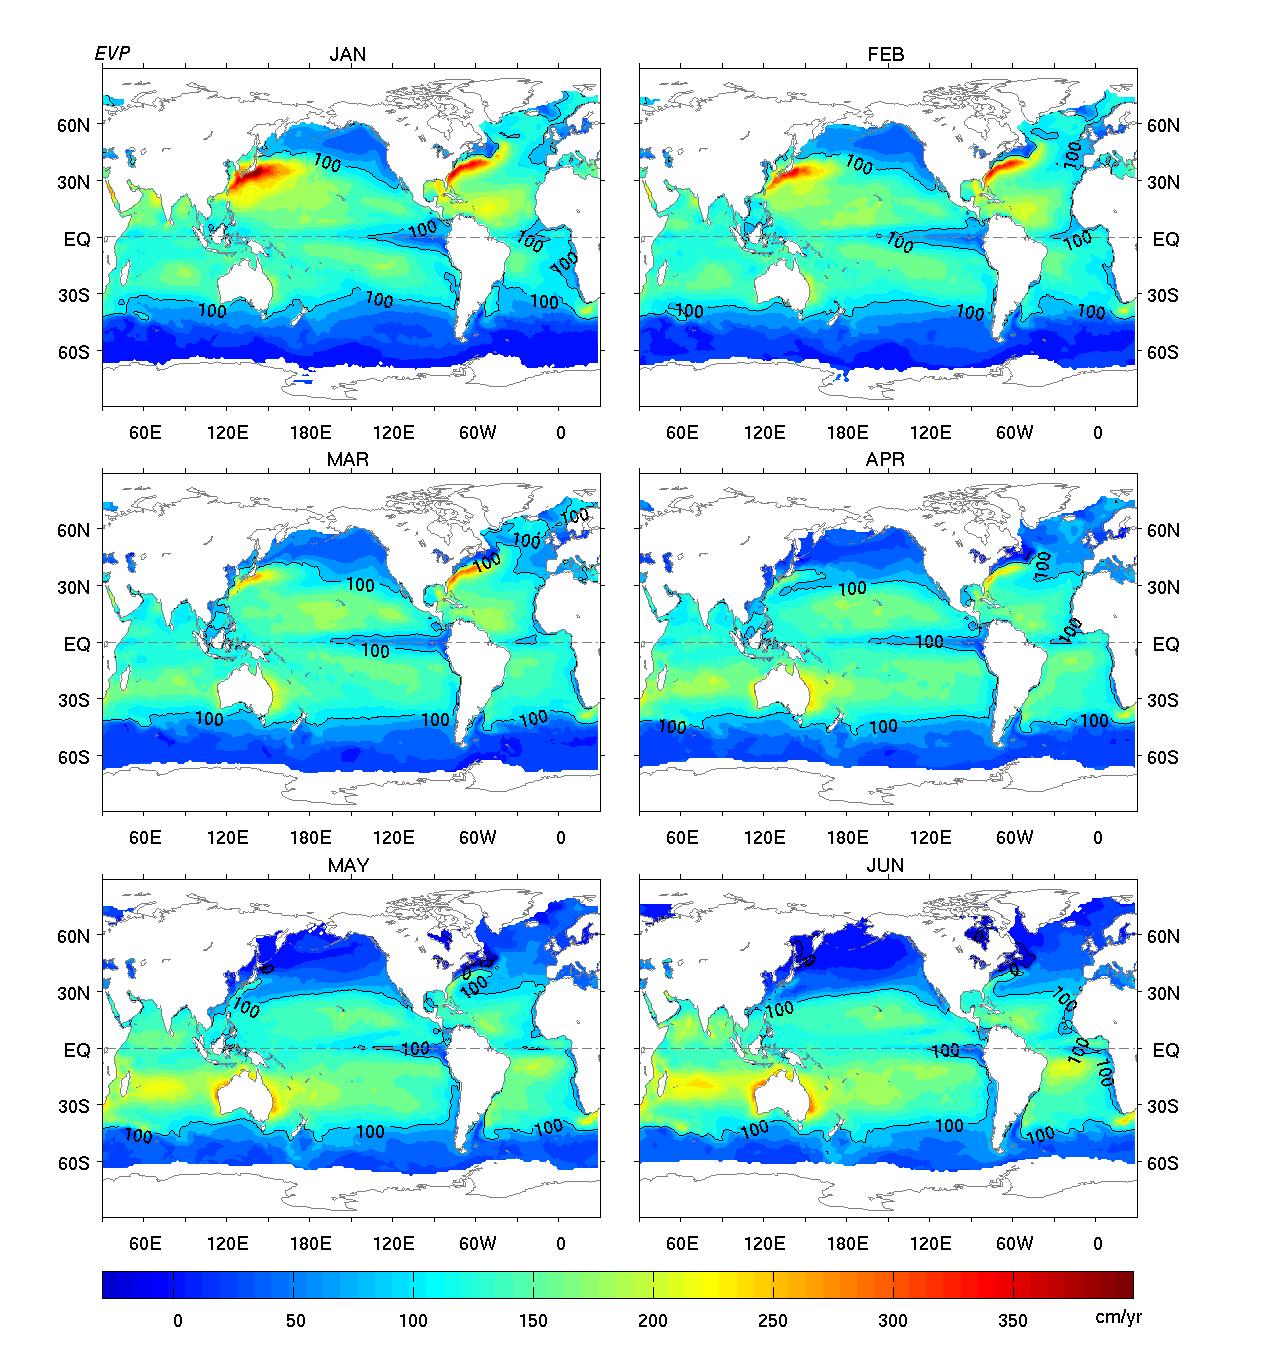
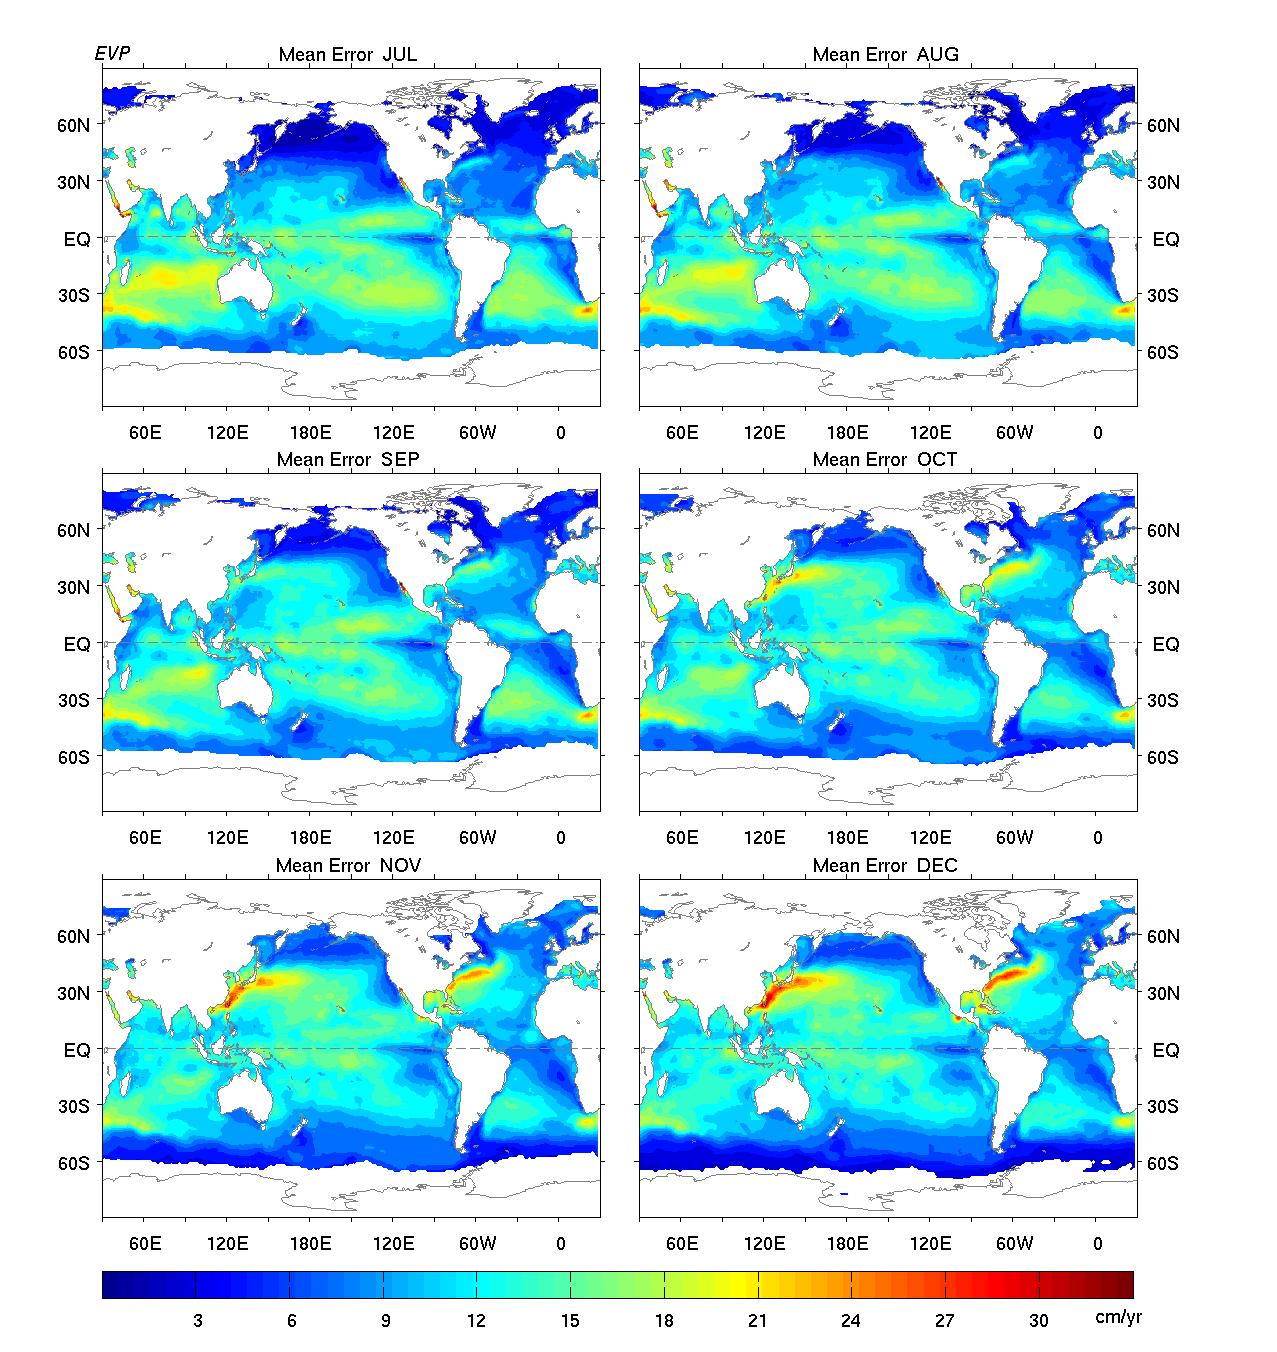
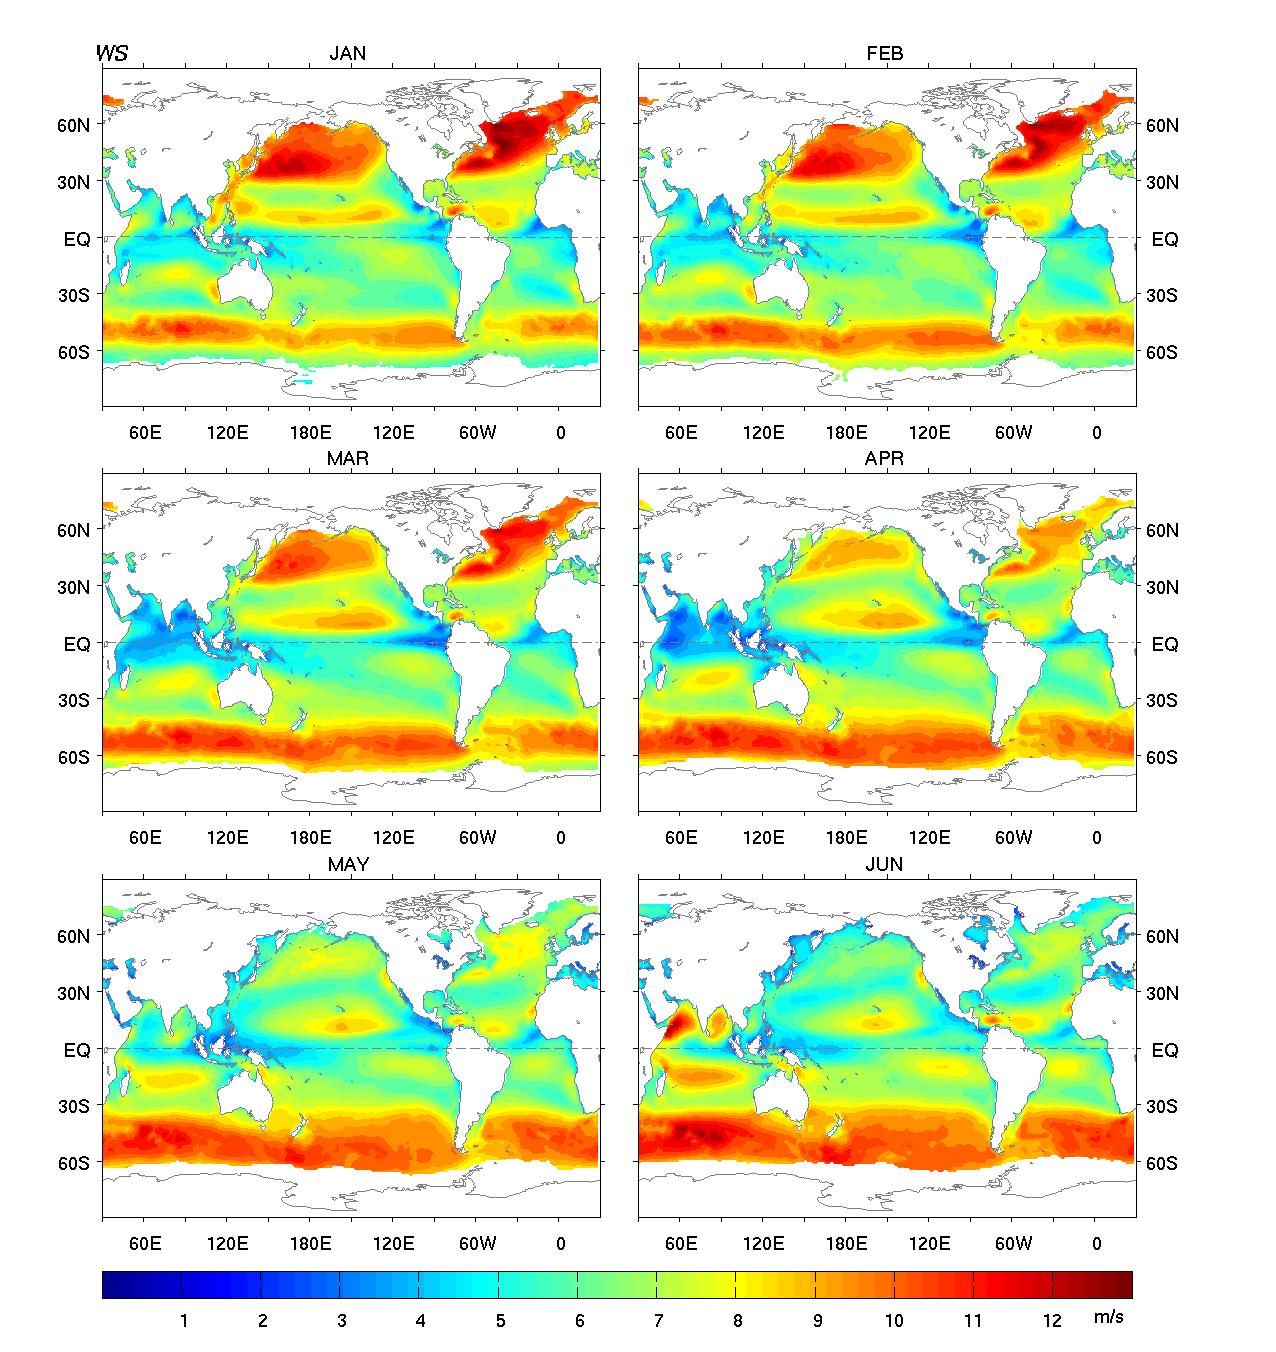
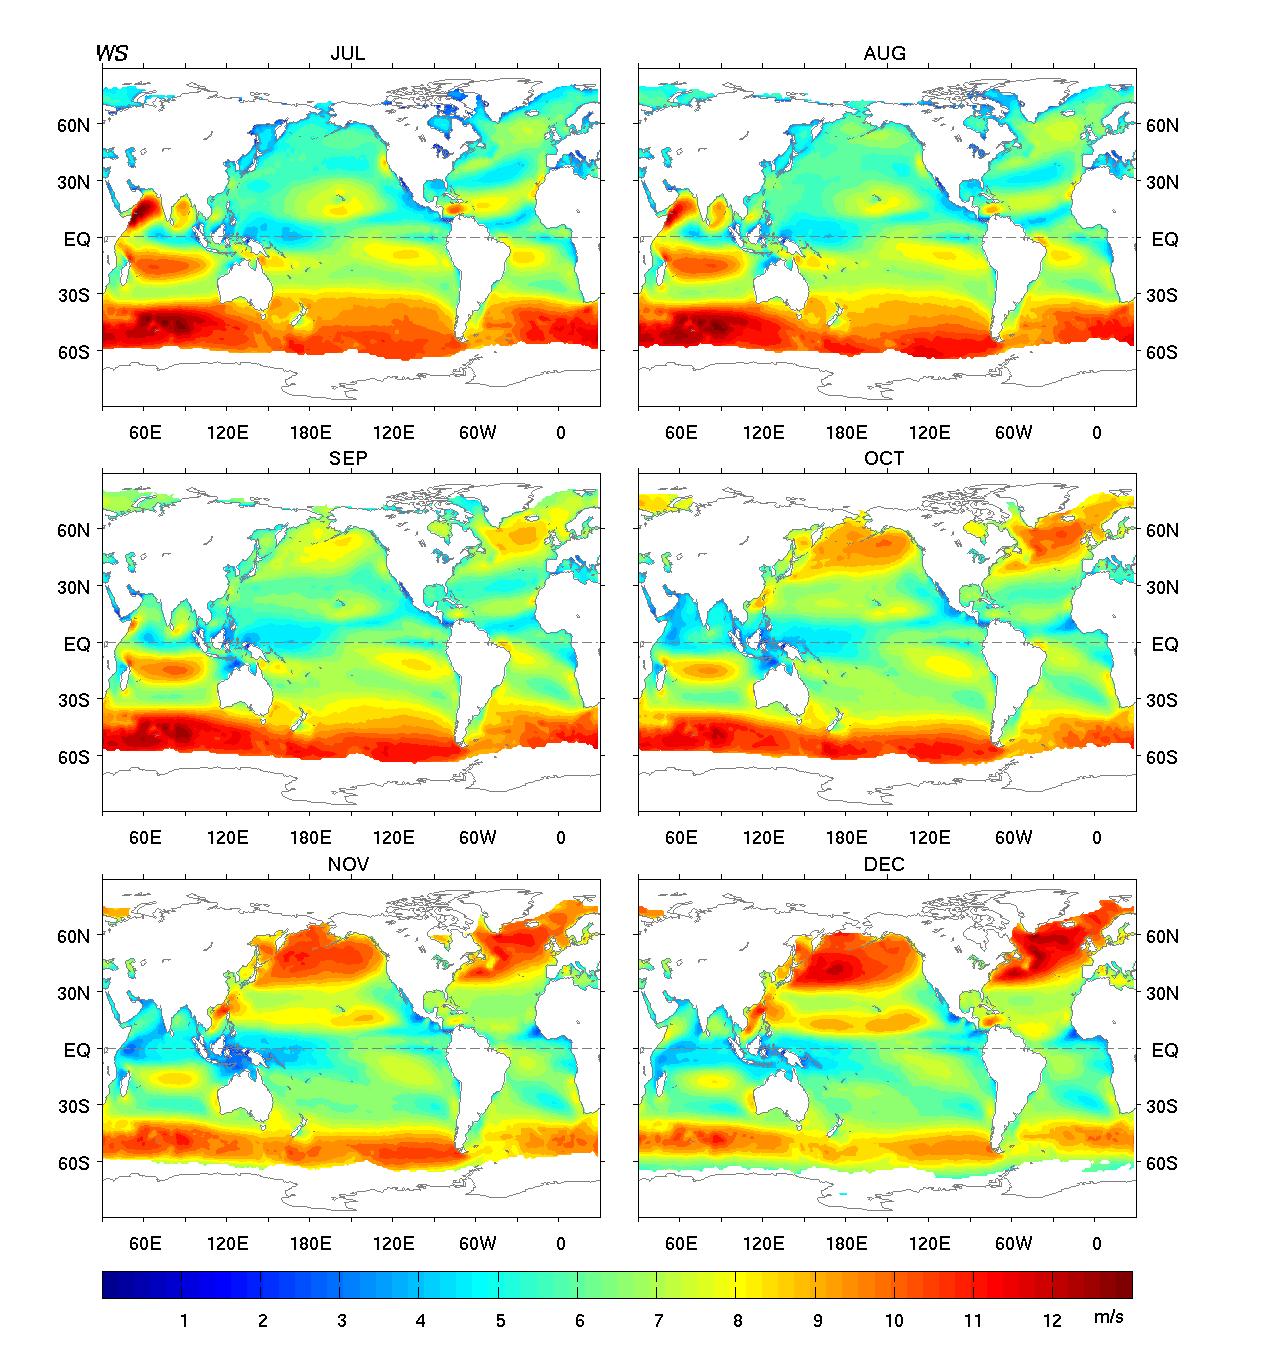
All represent the average over the period 1958-2006
- Latent heat flux (QLH): (a) Jan to Jun; (b) Jul to Dec.
- Estimated error of QLH: (a) Jan to Jun; (b) Jul to Dec.
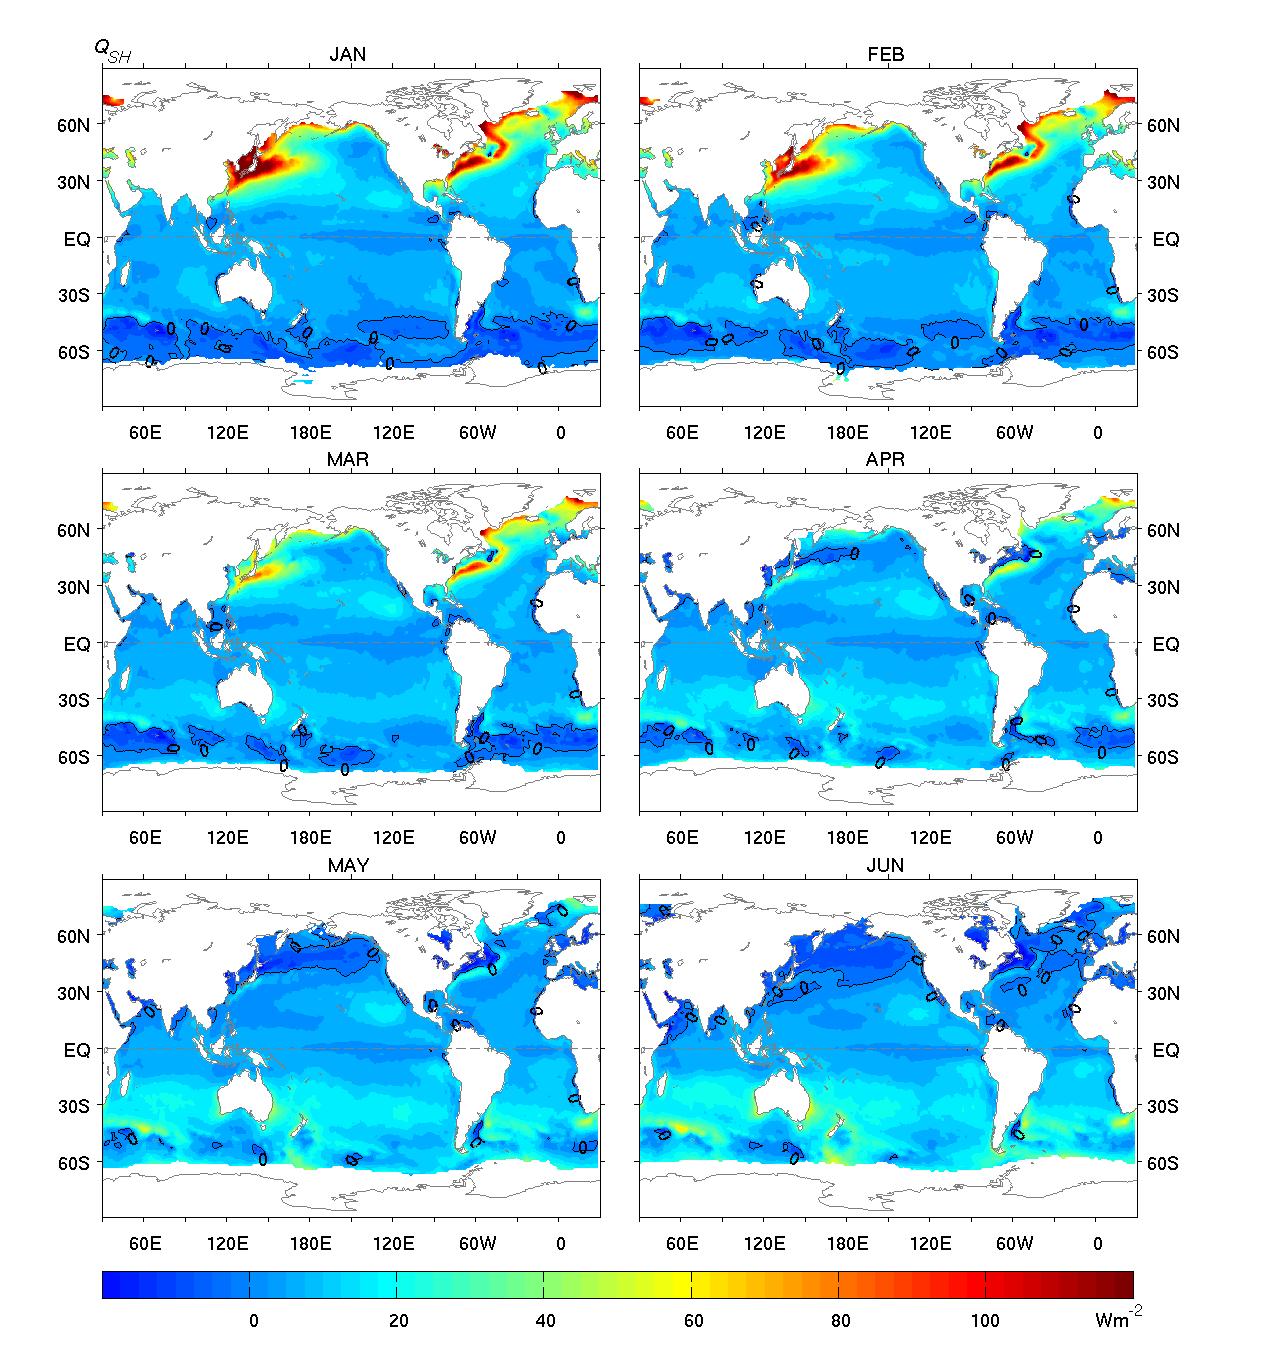
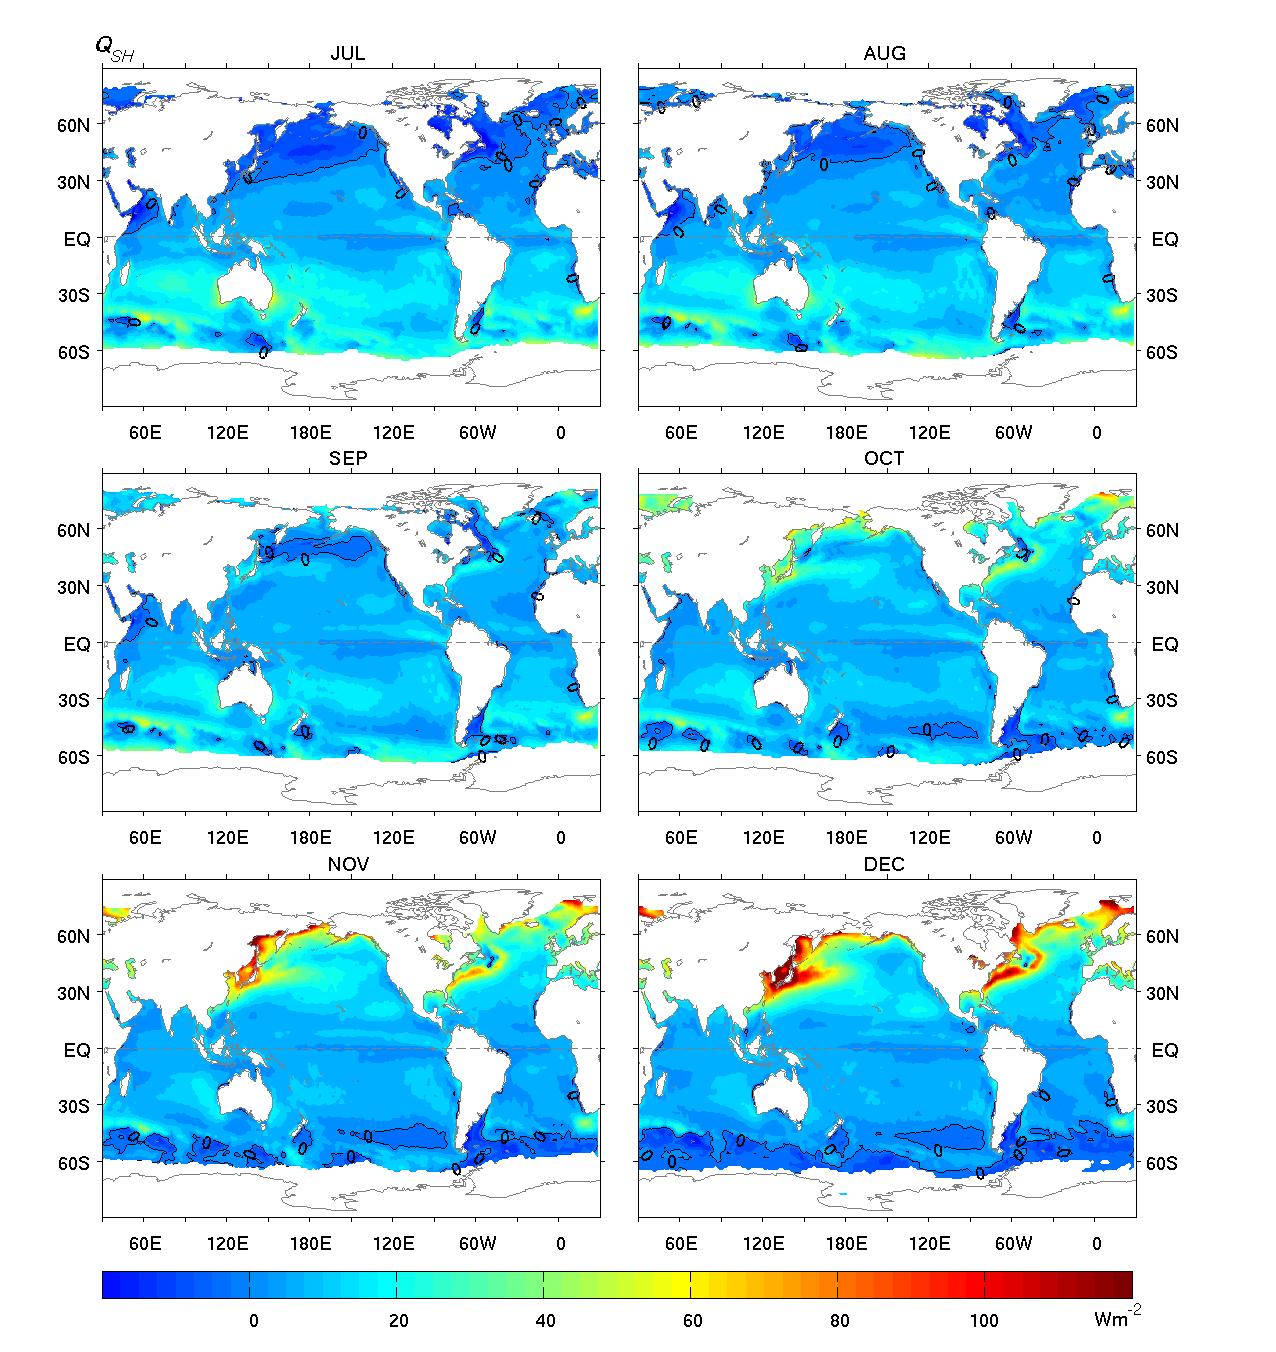
- Sensible heat flux (QSH): (a) Jan to Jun; (b) Jul to Dec.
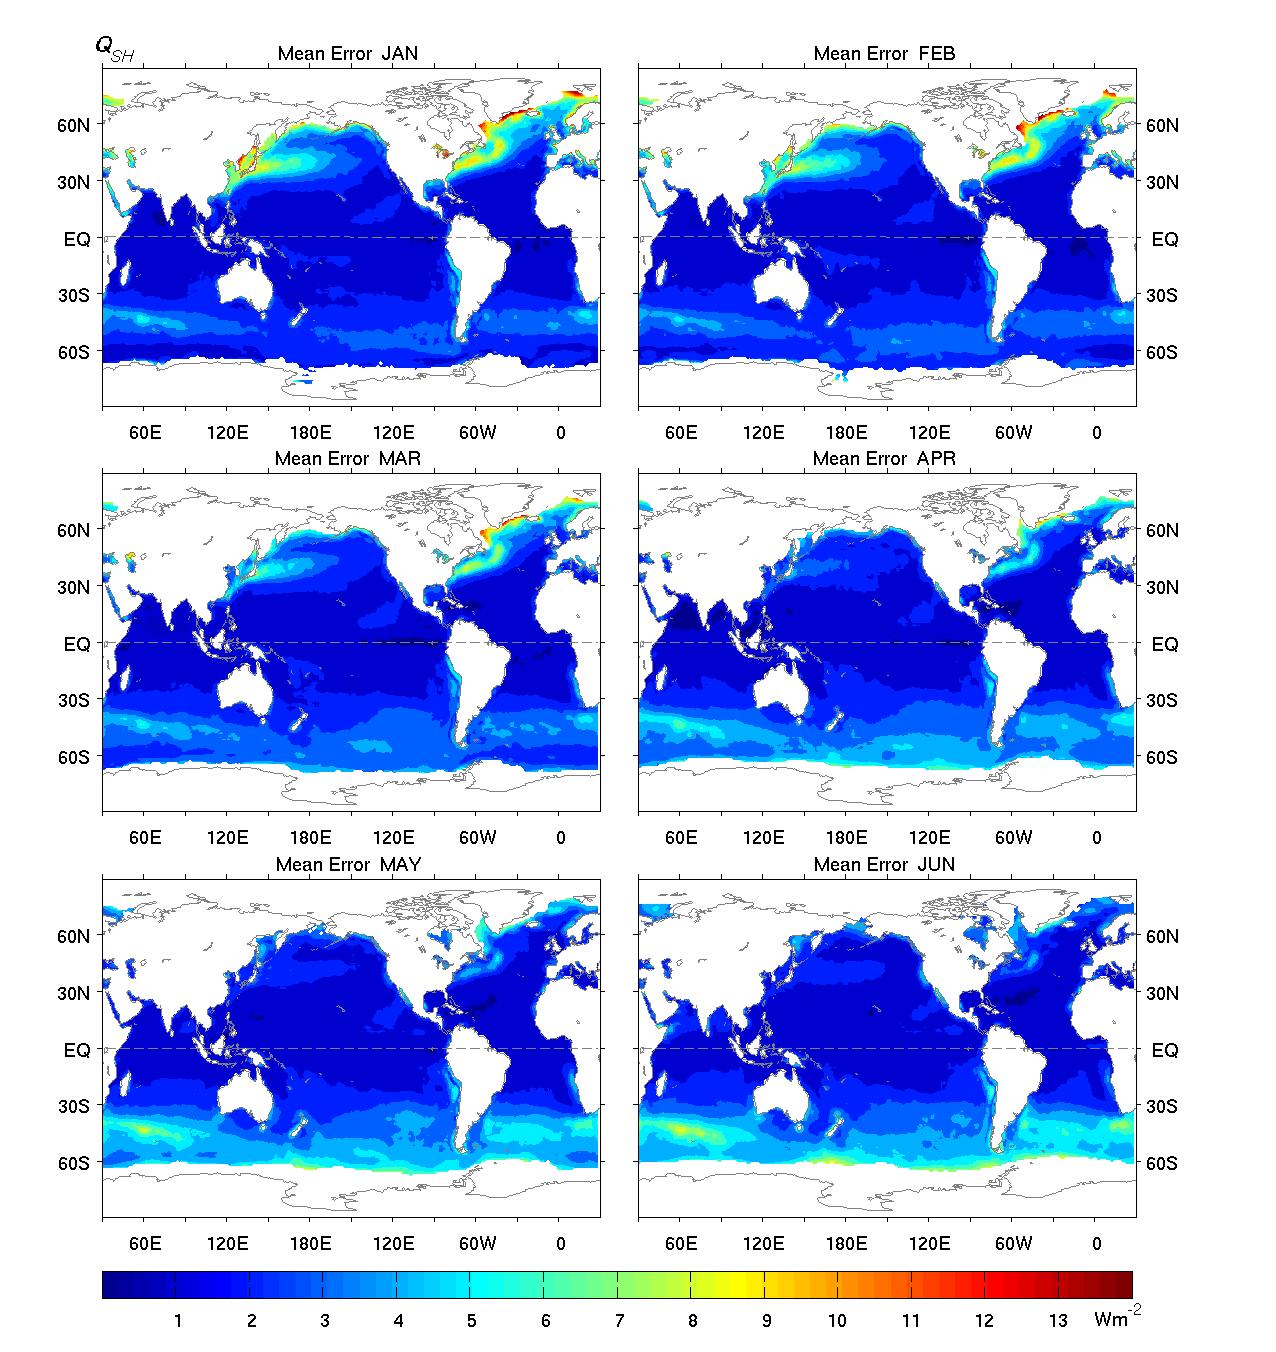
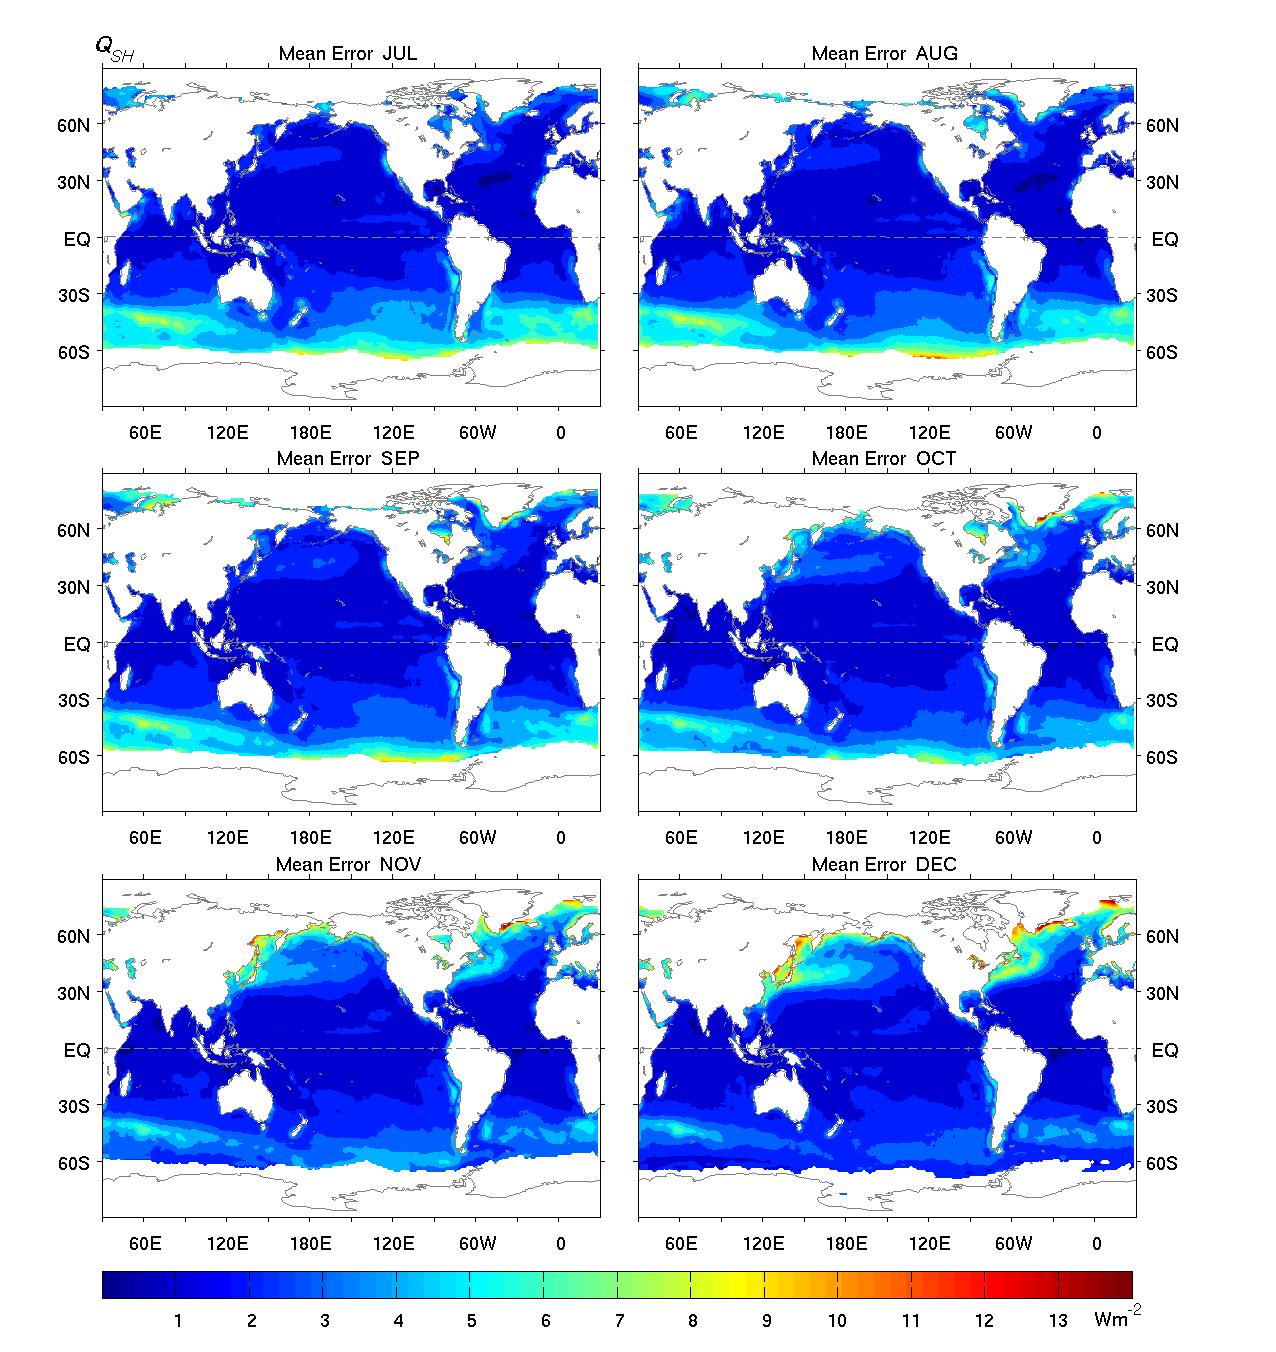
- Estimated error of QSH: (a) Jan to Jun; (b) Jul to Dec.
- Ocean Evaporation (E): (a) Jan to Jun; (b) Jul to Dec.
- Estimated error of E: (a) Jan to Jun; (b) Jul to Dec.
- Wind speed (W) at 10m: (a) Jan to Jun; (b) Jul to Dec.
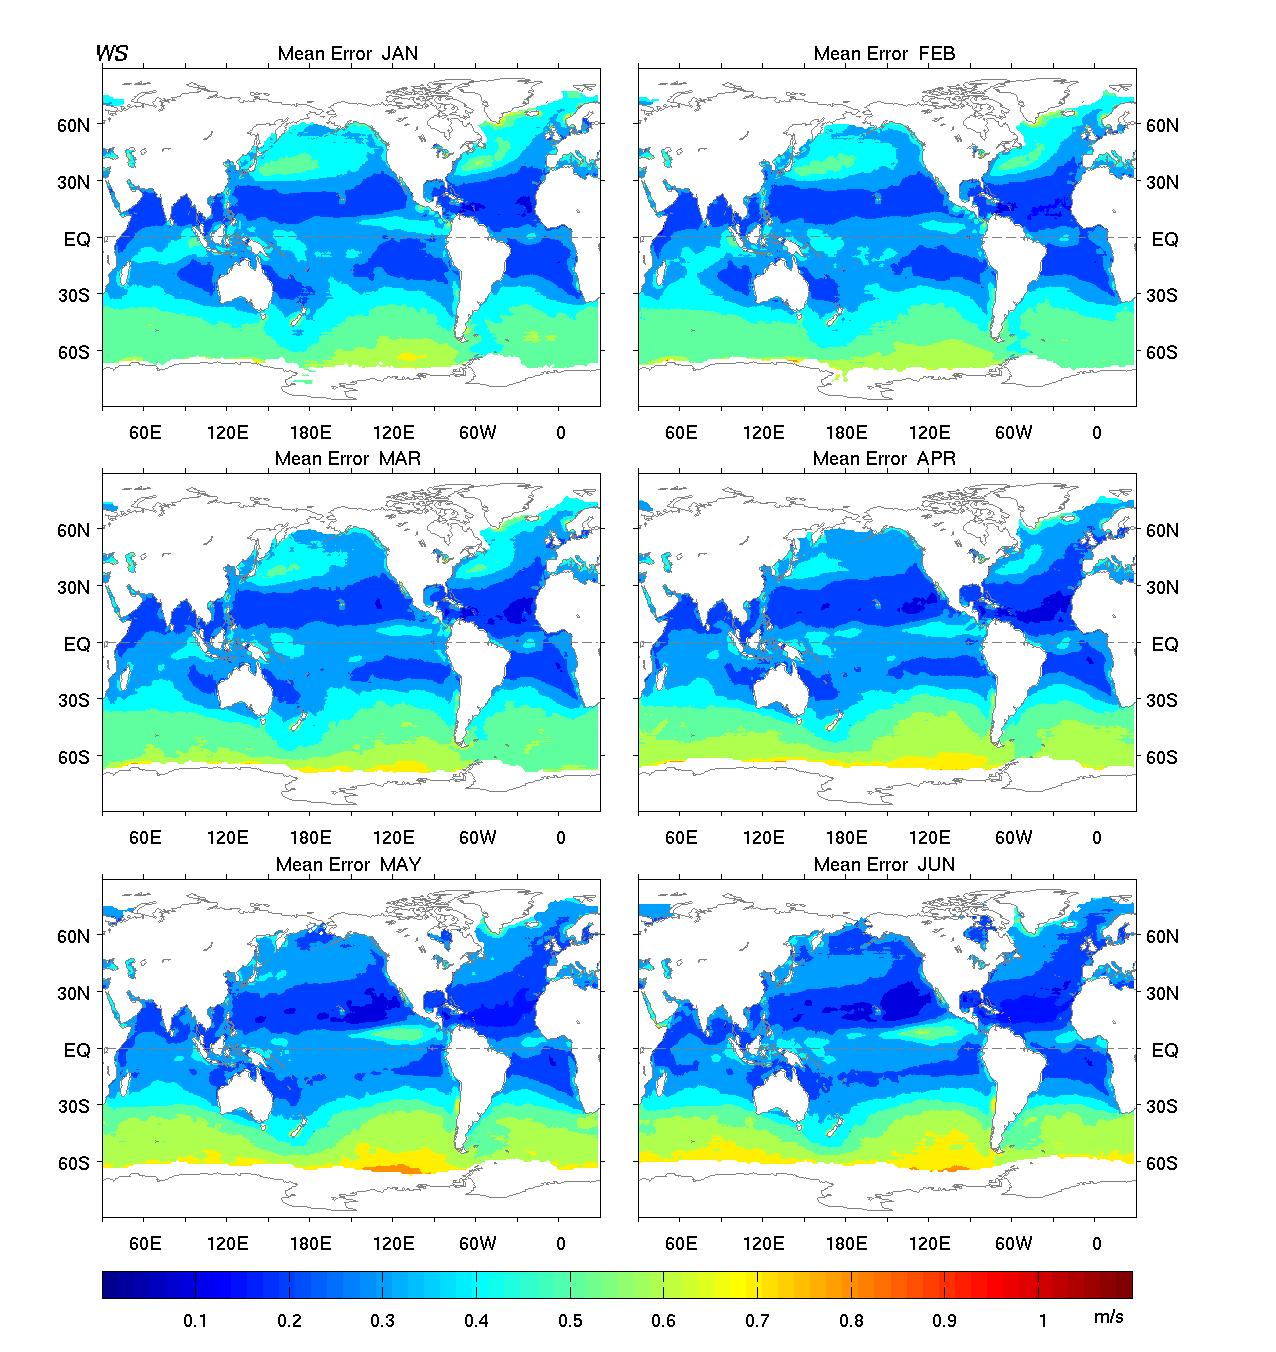
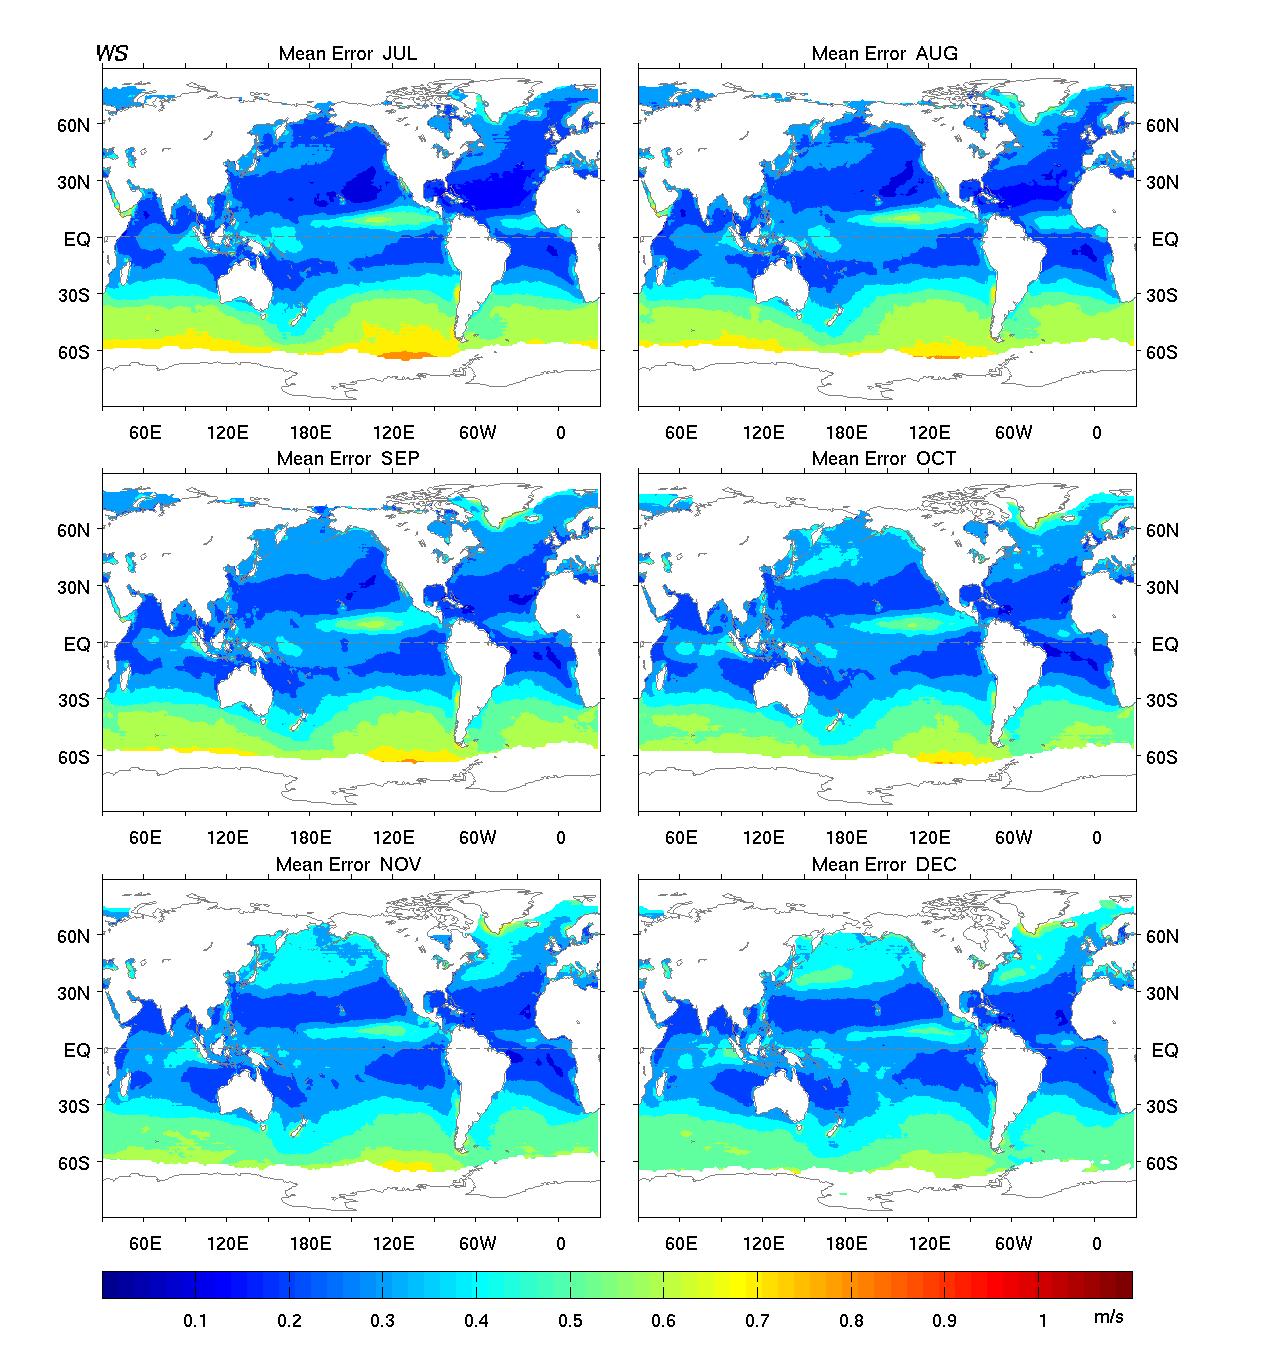
- Estimated error of W: (a) Jan to Jun; (b) Jul to Dec.
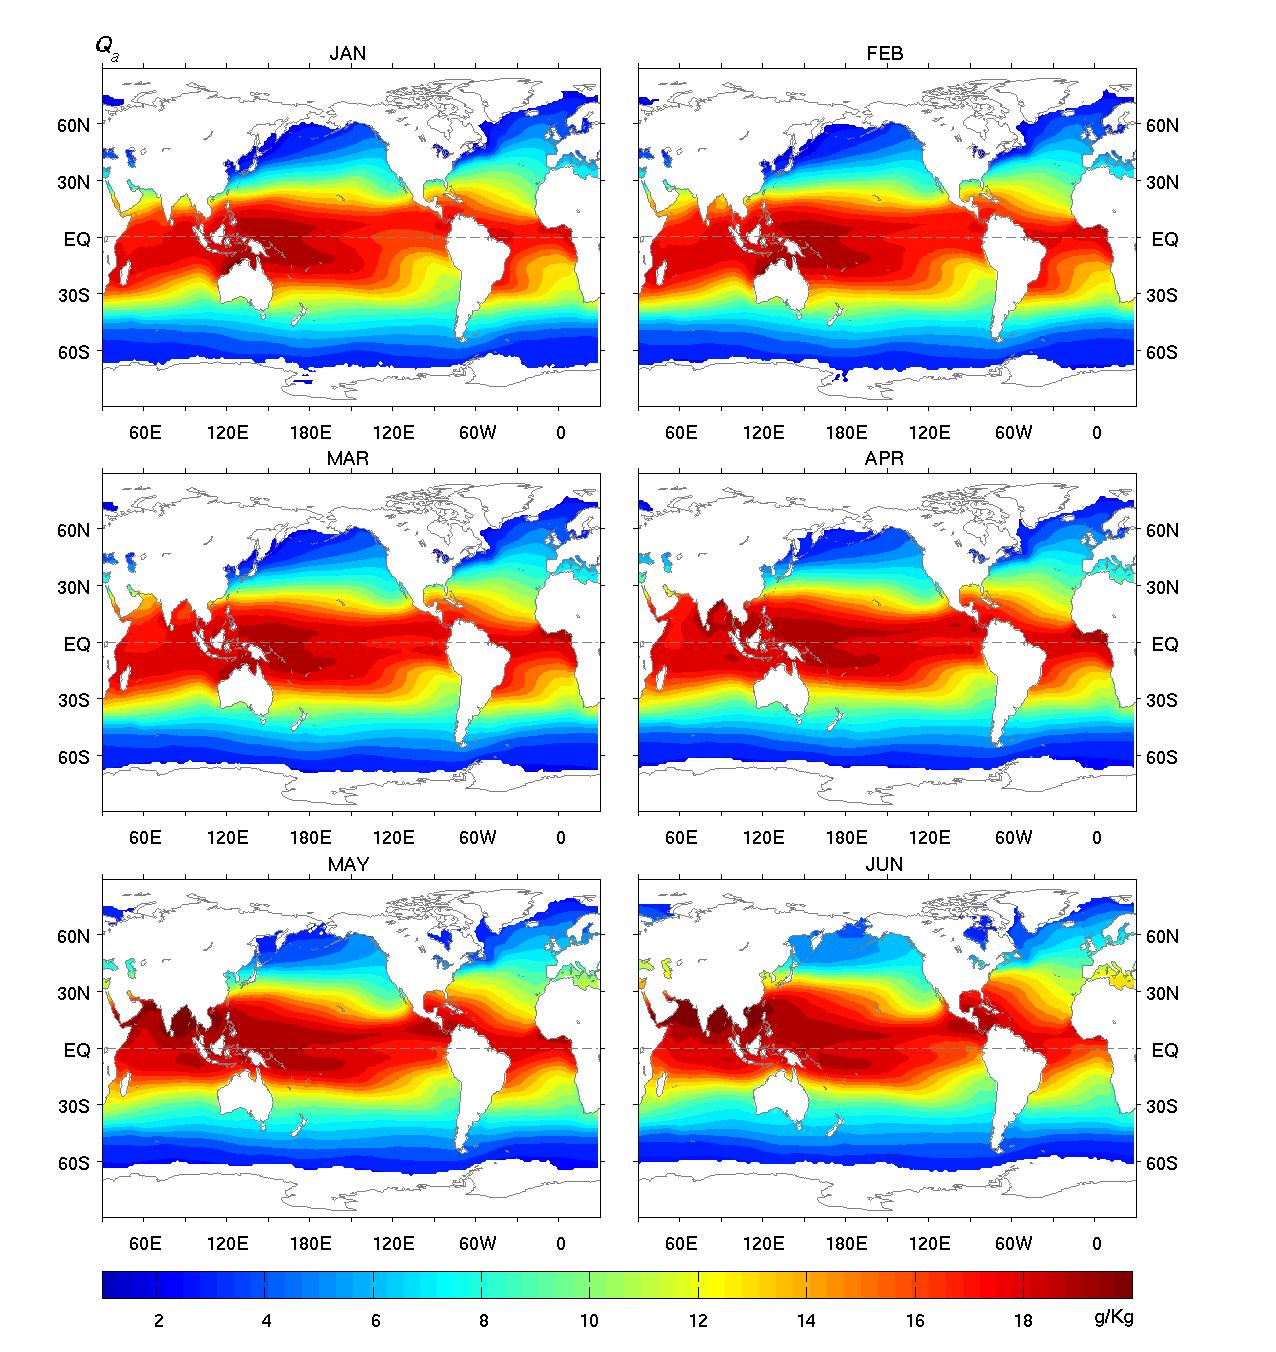
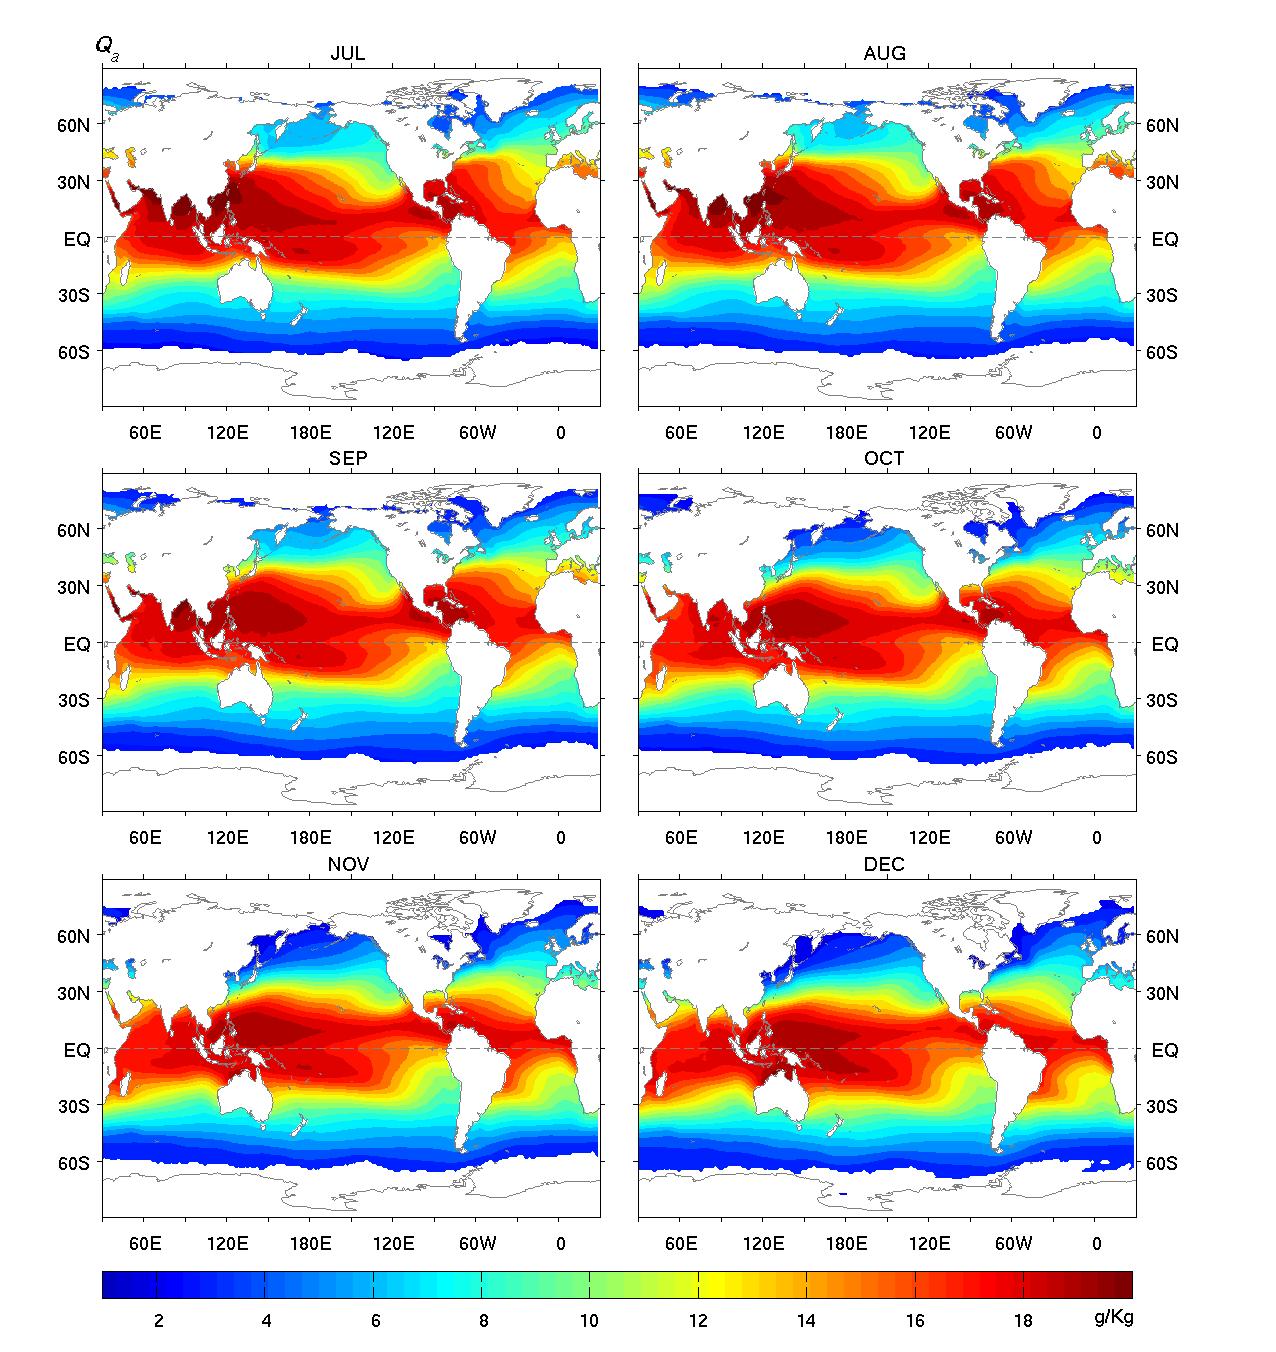
- Specific air humidity (qa) at 2m: (a) Jan to Jun; (b) Jul to Dec.
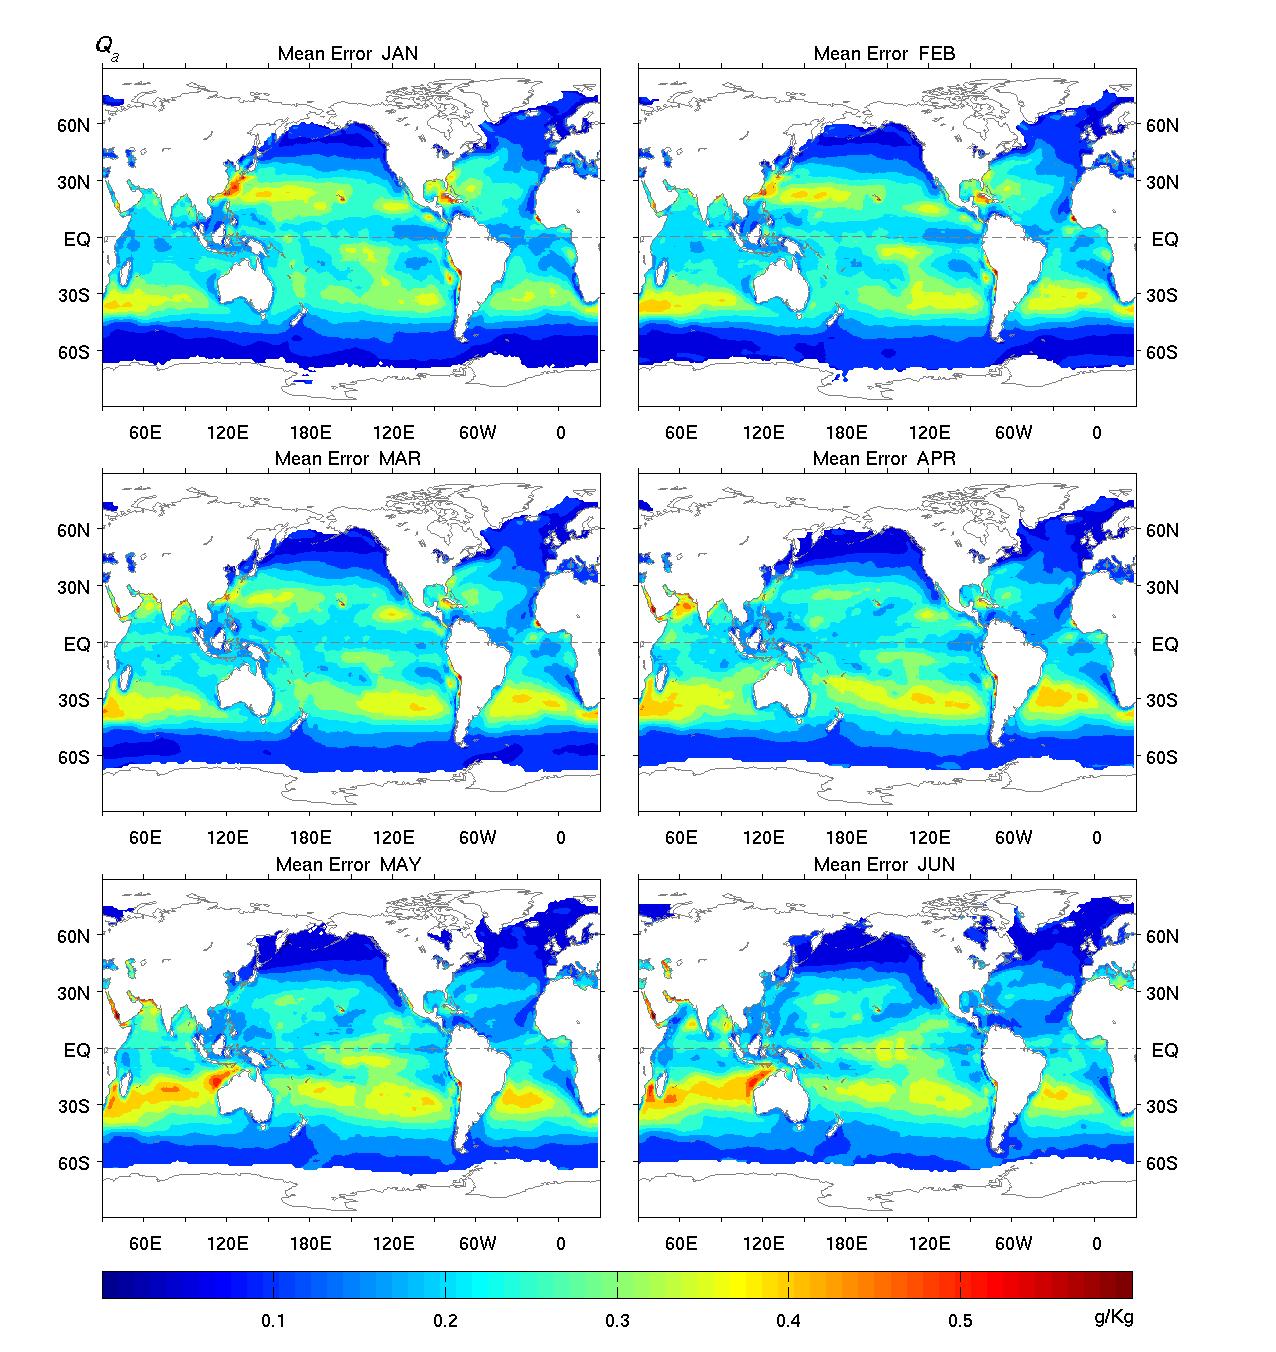
- Estimated error of qa: (a) Jan to Jun; (b) Jul to Dec.
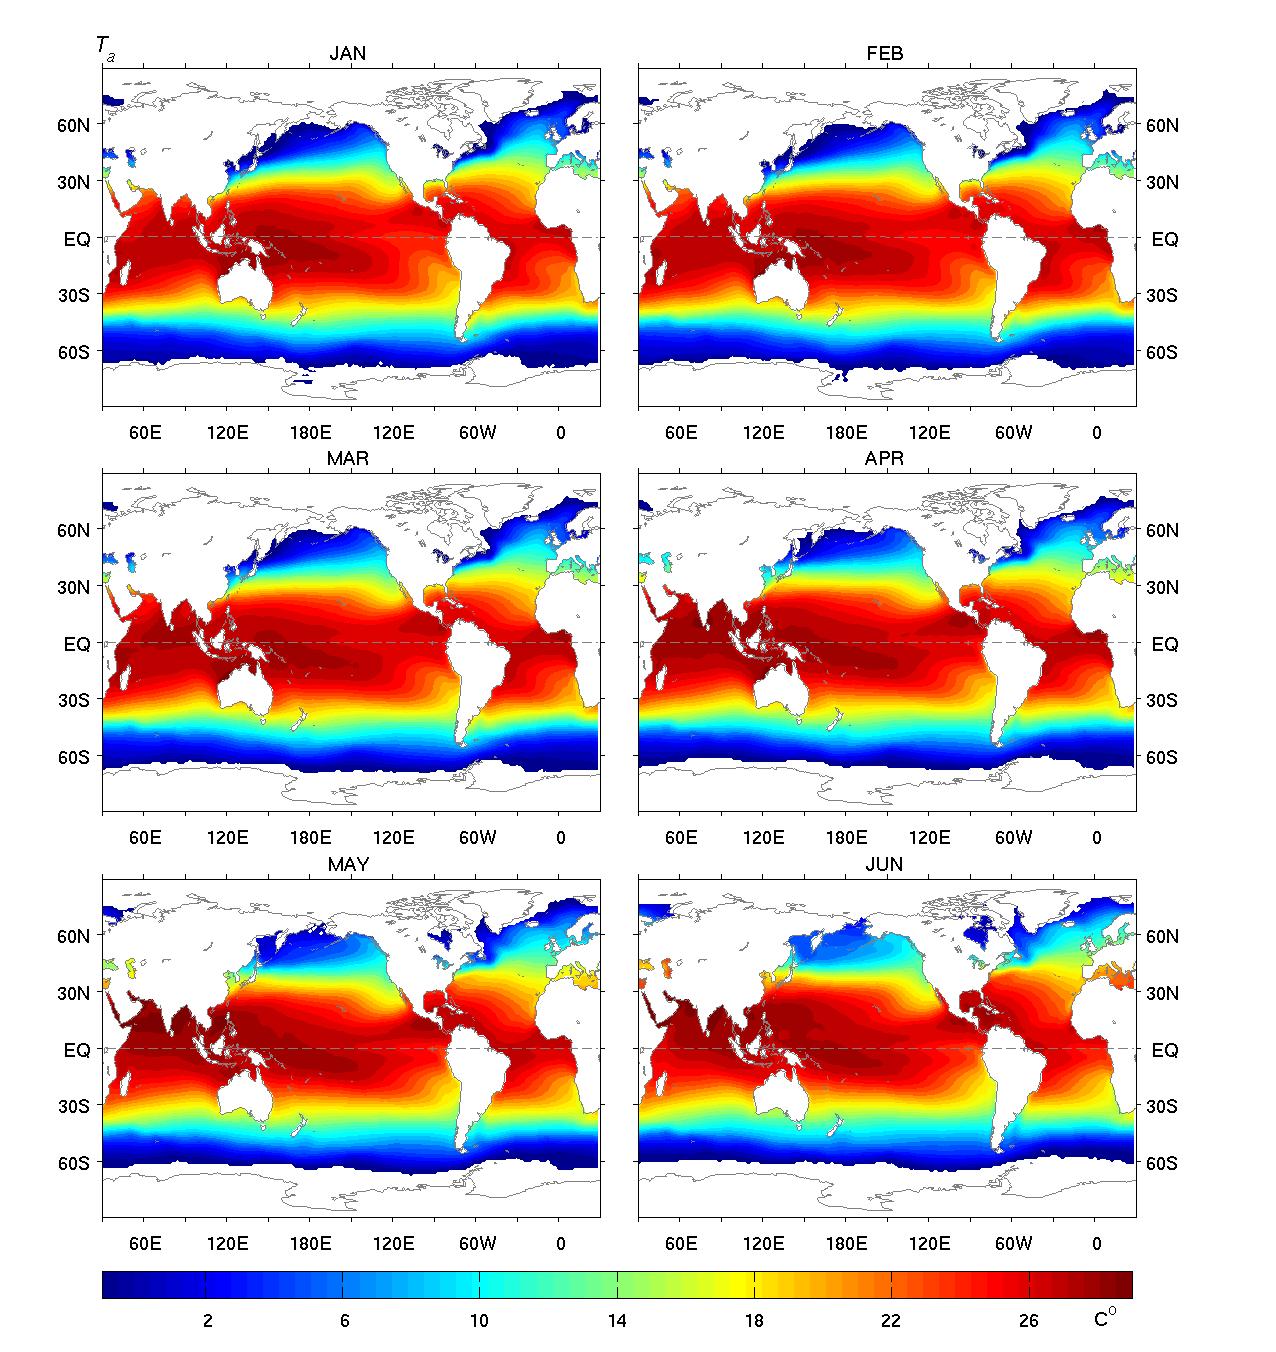
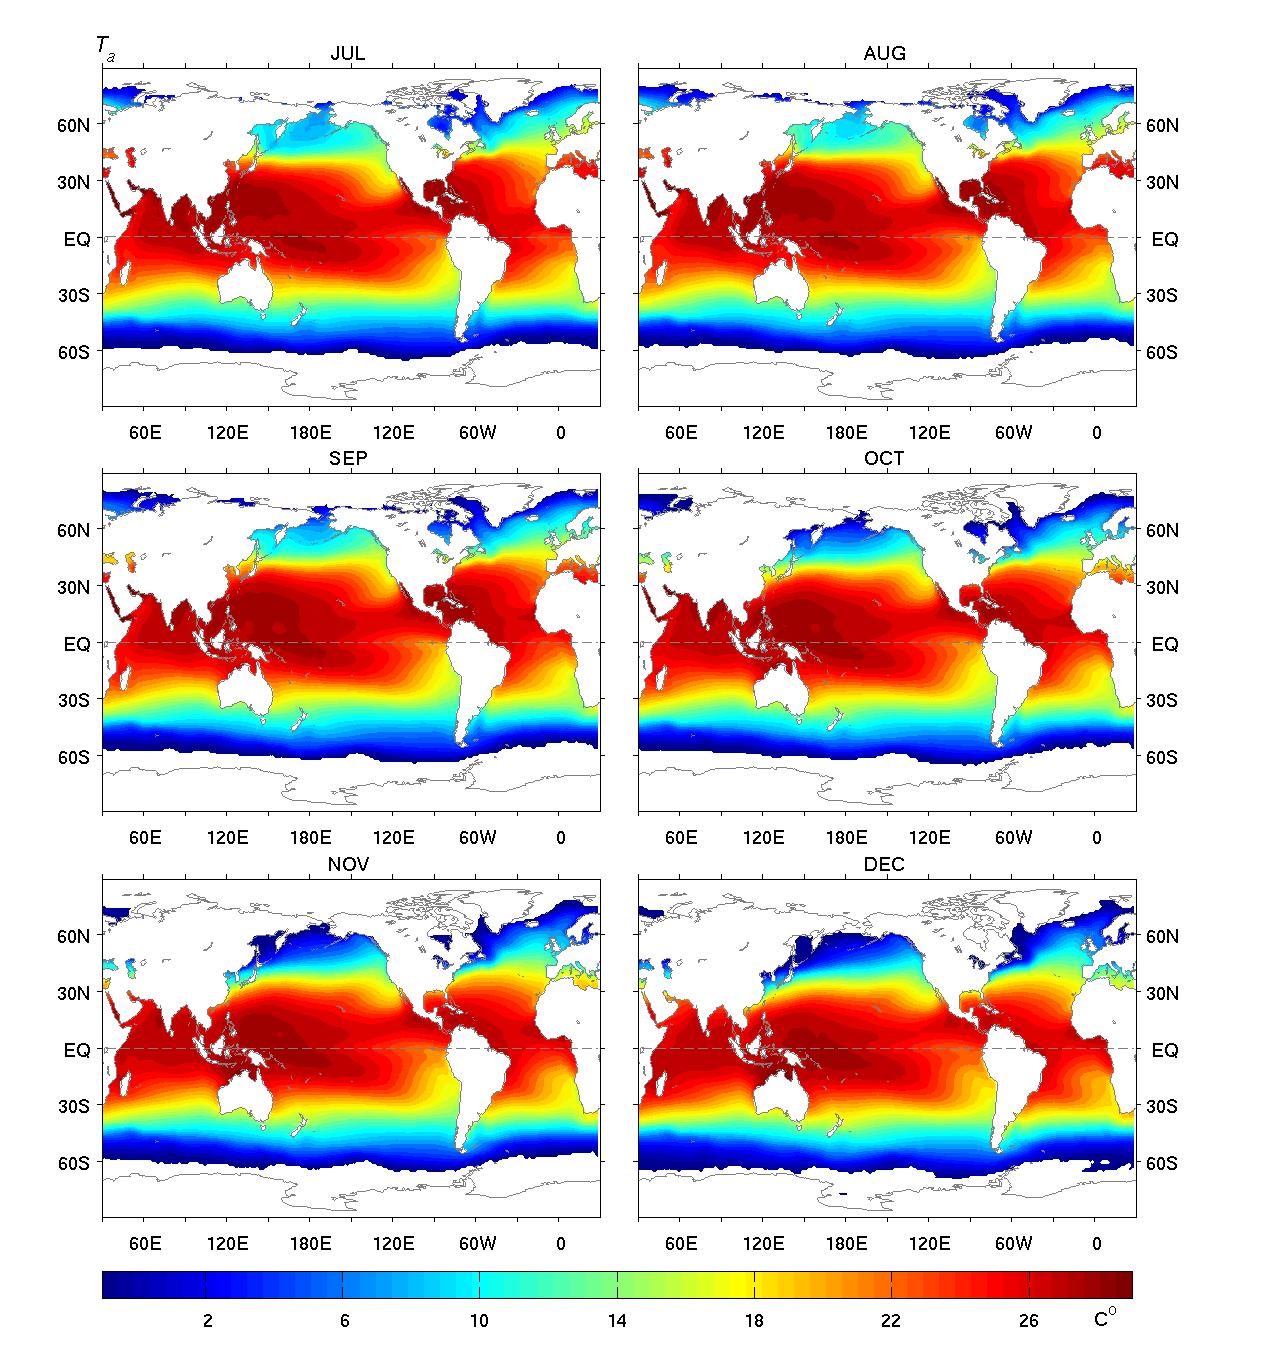
- Air temperature (Ta) at 2m: (a) Jan to Jun; (b) Jul to Dec.
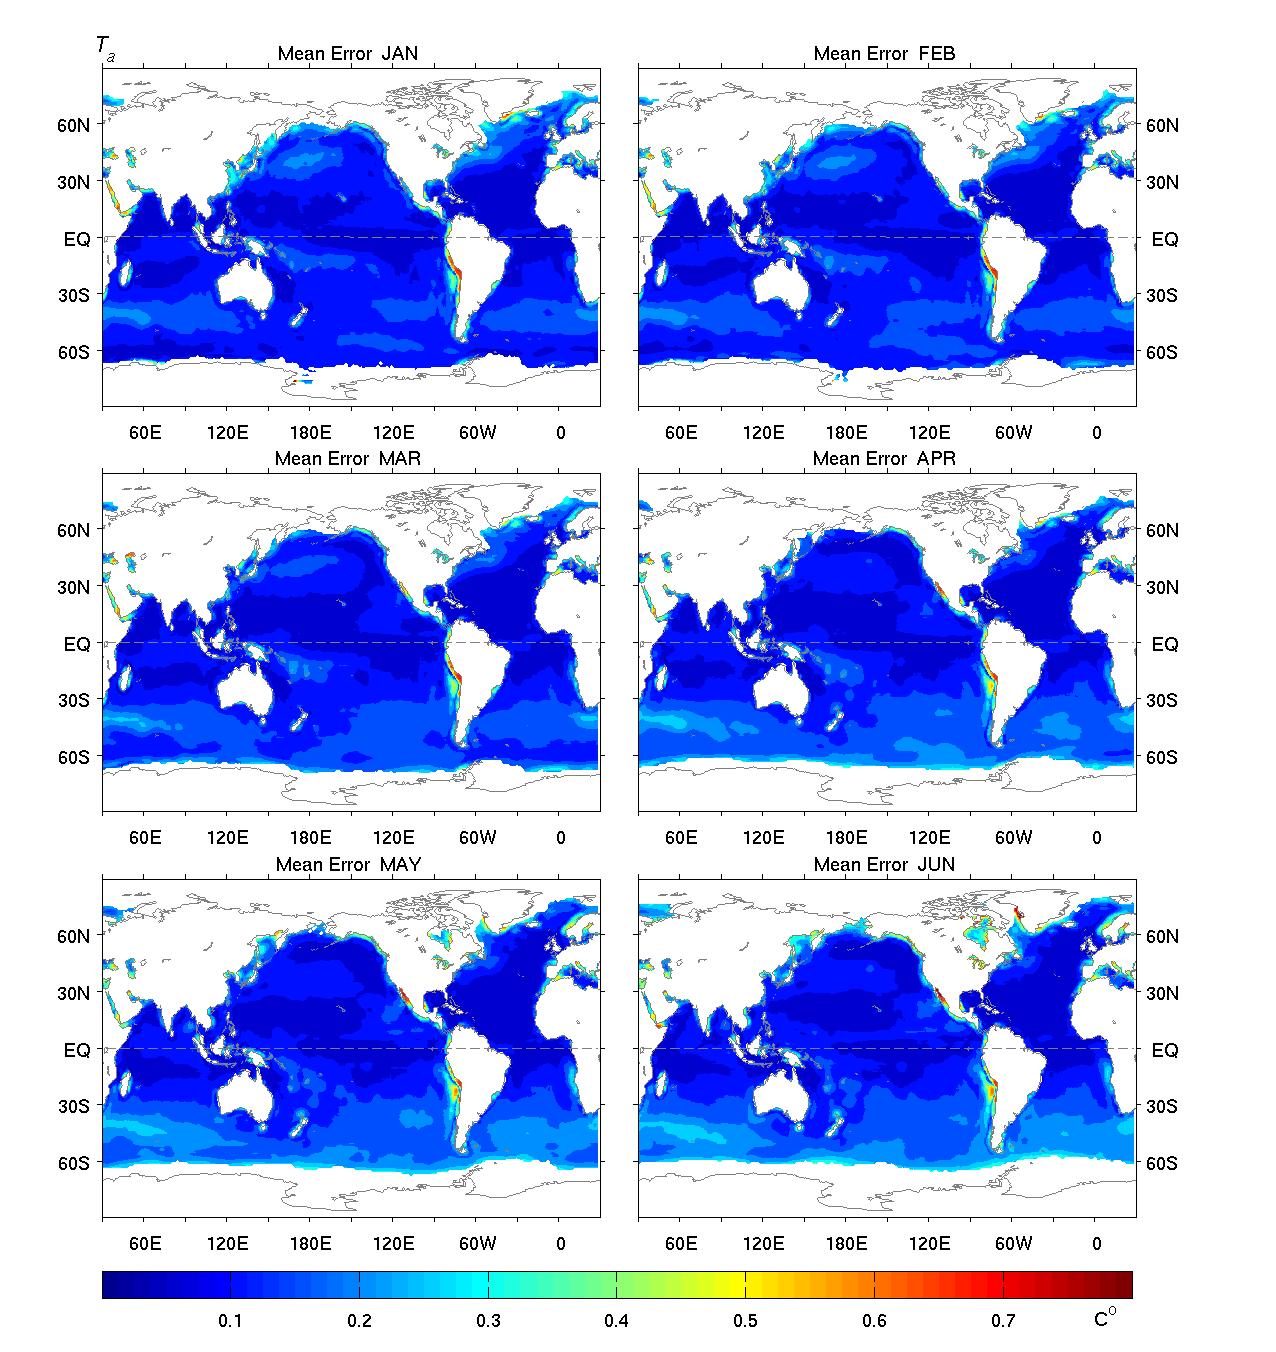
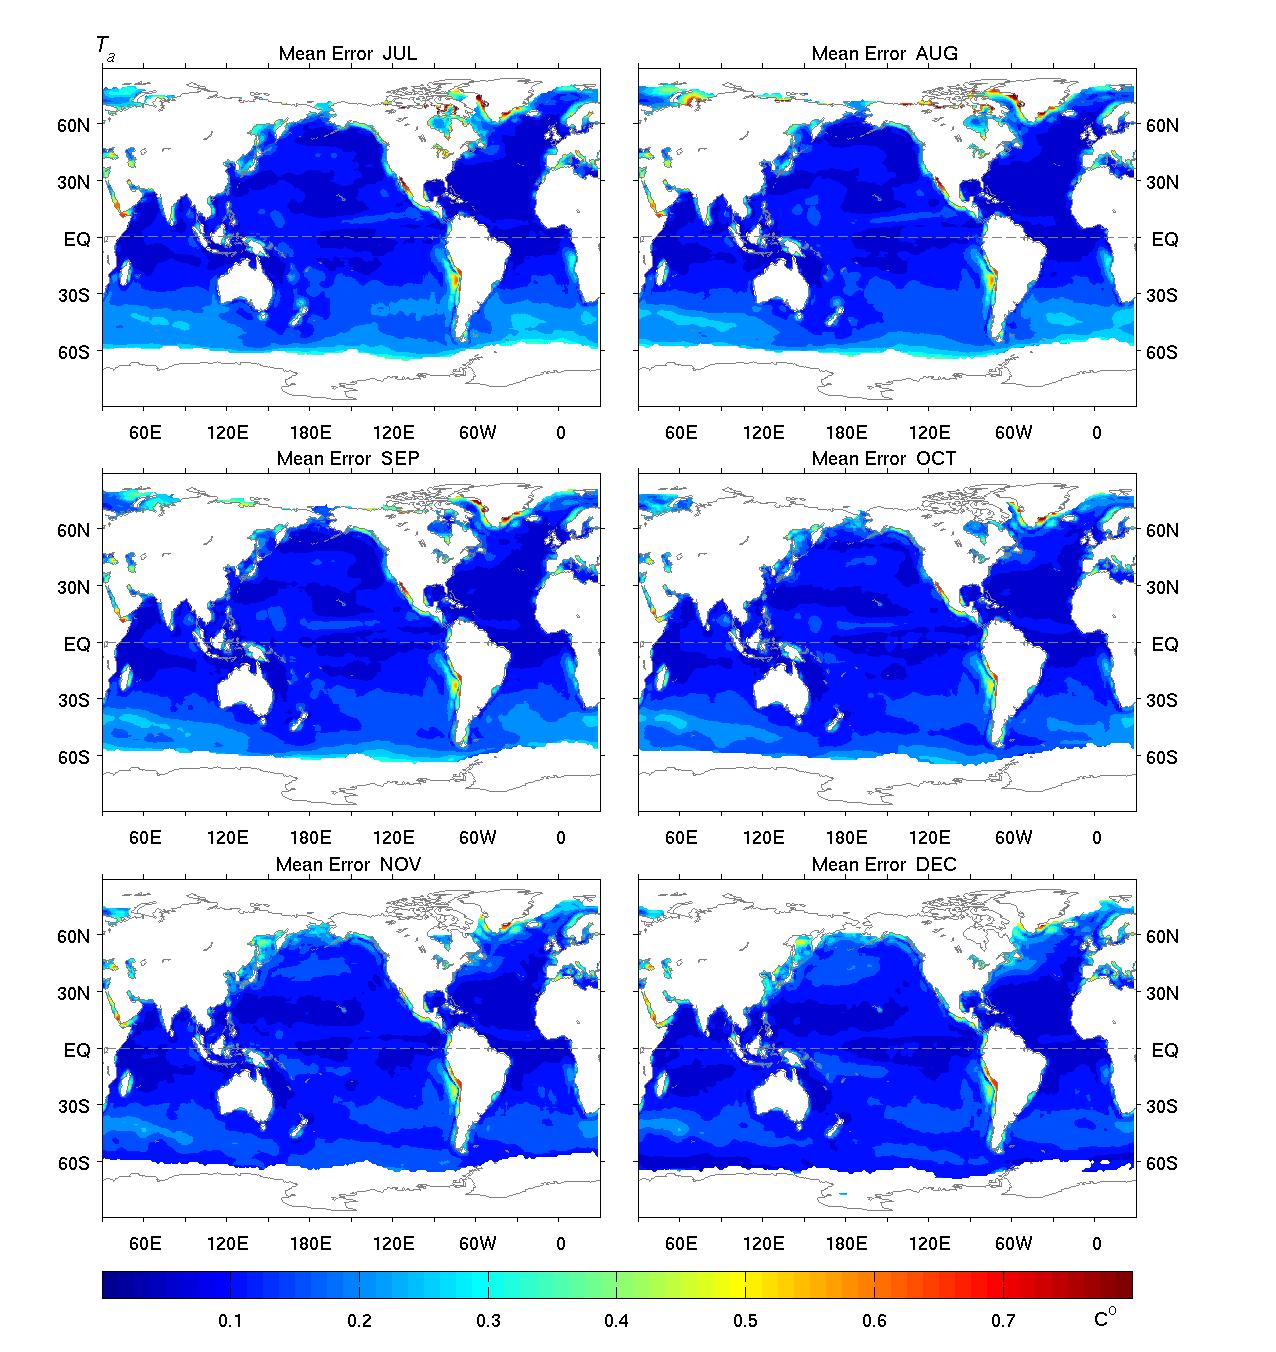
- Estimated error of Ta: (a) Jan to Jun; (b) Jul to Dec.
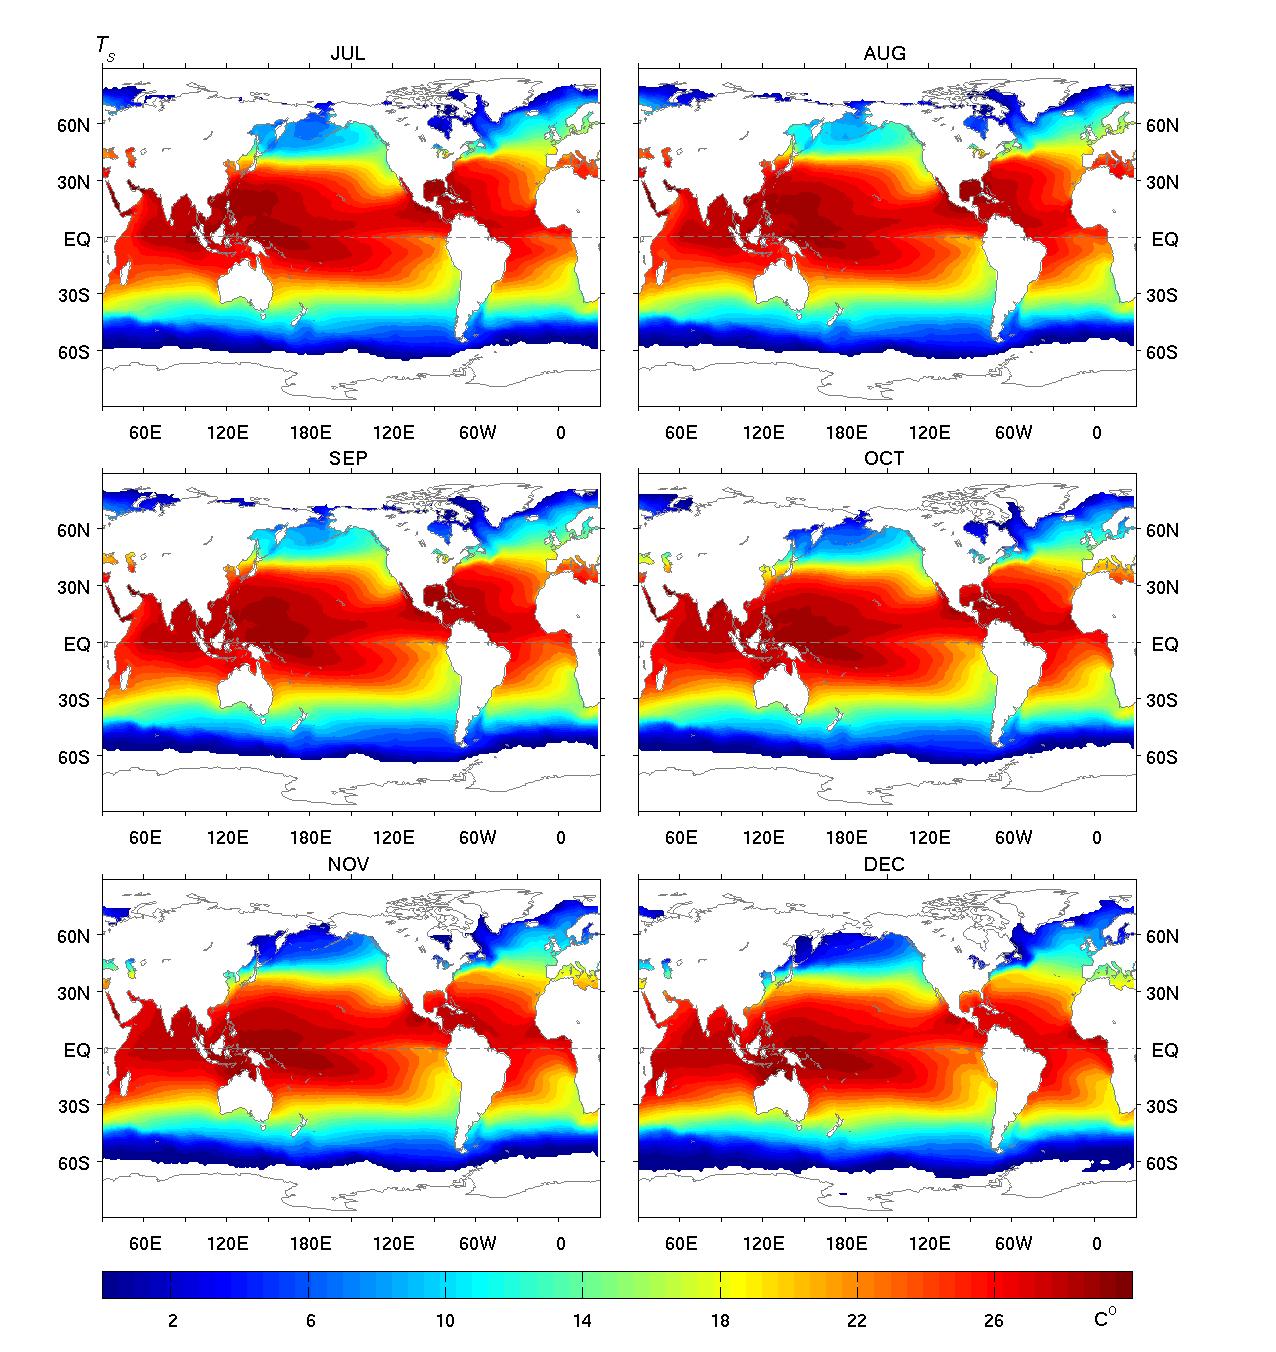
- Sea surface temperature (Ts): (a) Jan to Jun; (b) Jul to Dec.
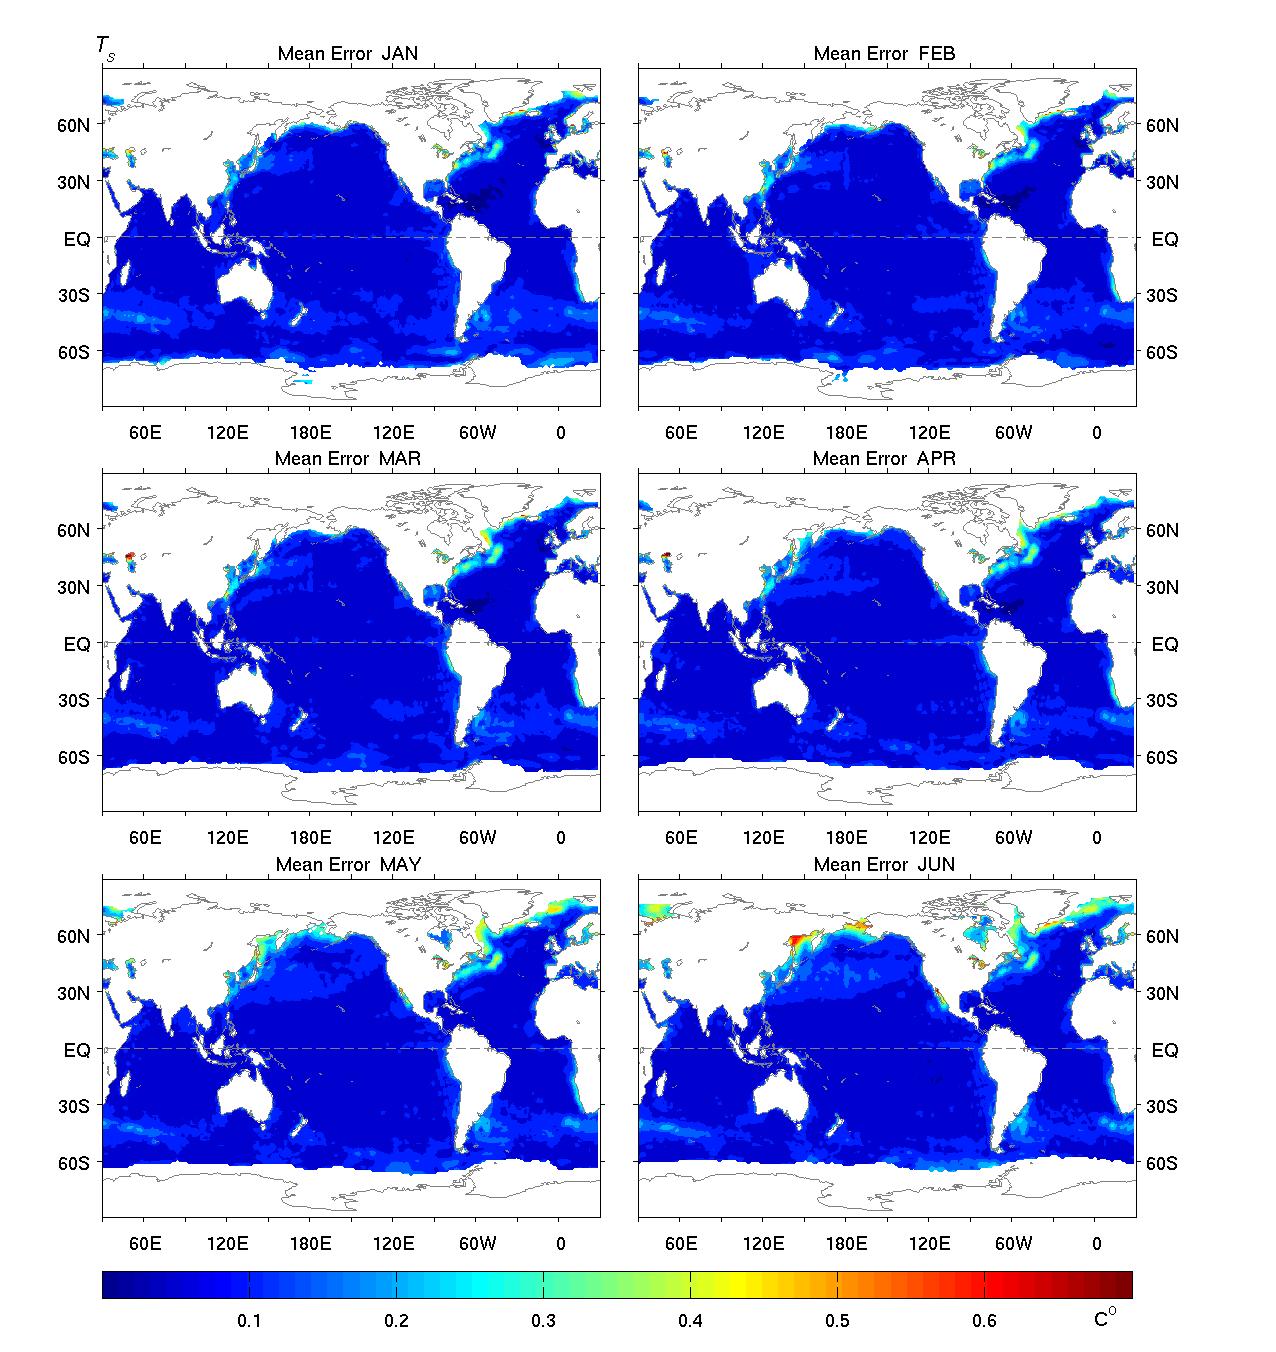
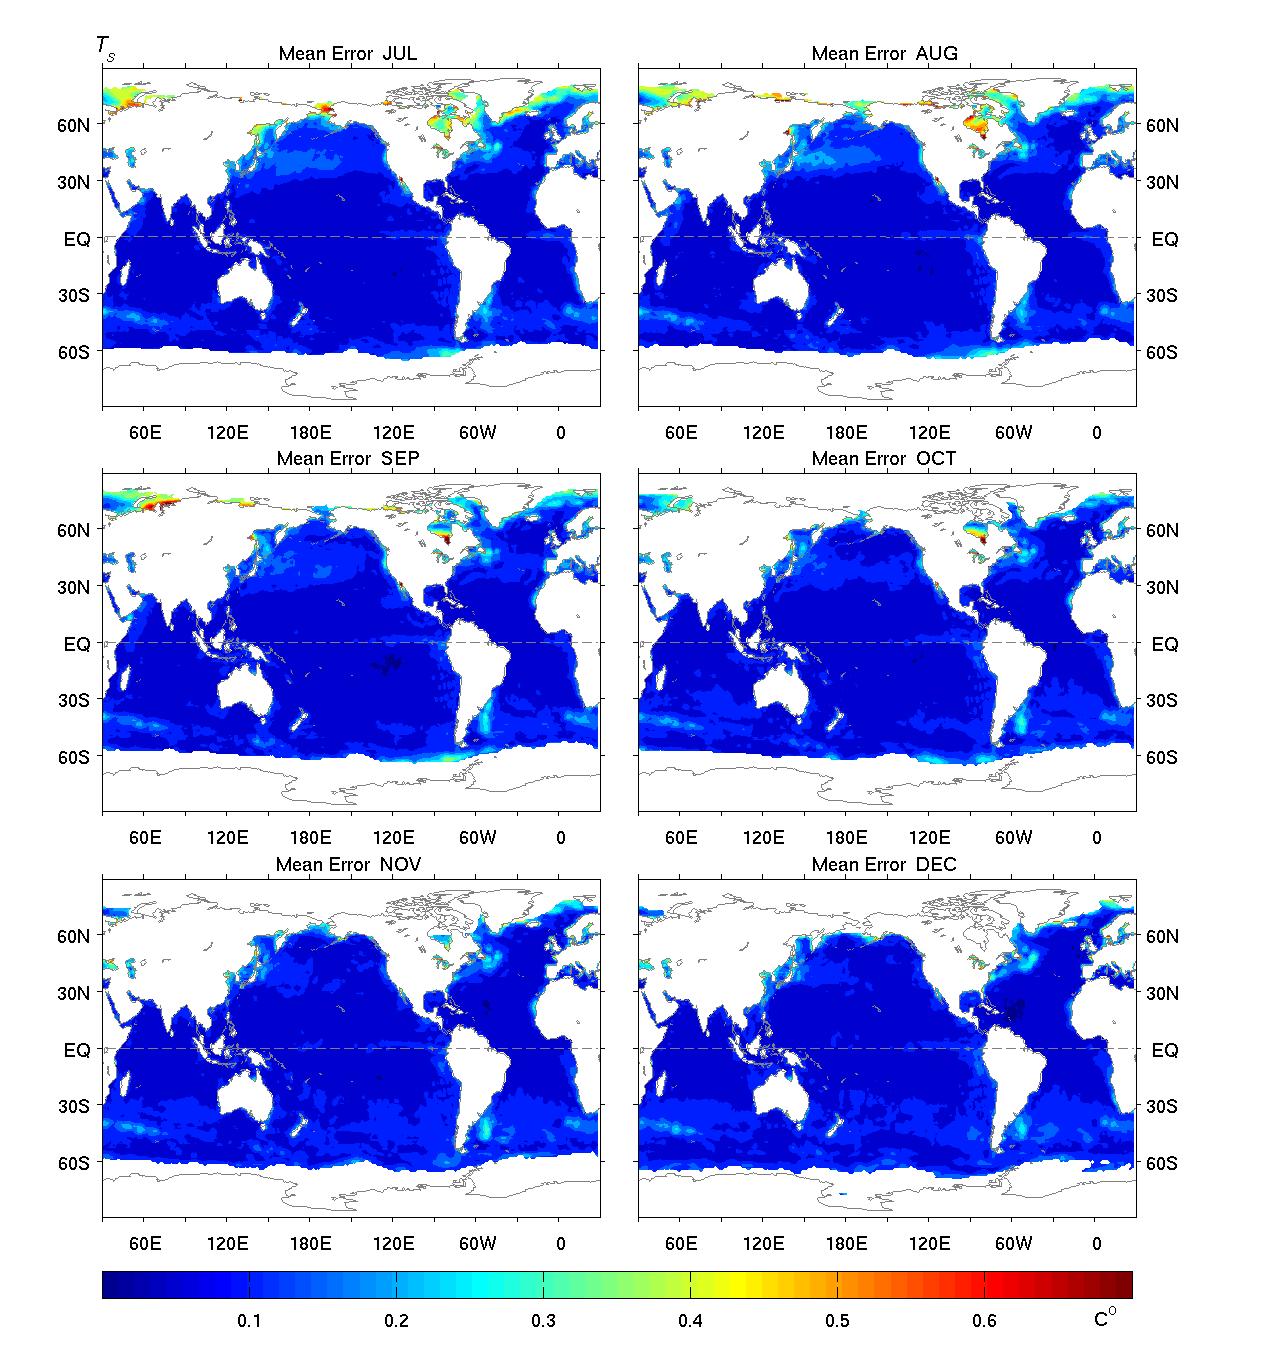
- Estimated error of Ts: (a) Jan to Jun ; (b) Jul to Dec.